UnRisk PRICING ENGINE
Examples
webUnRisk
Try webUnRisk, an interactive risk-analysis tool. It is just one example of the types of financial analysis you can perform when you combine the top-notch derivatives pricing engine UnRisk PRICING ENGINE with the online technical computing power of webMathematica.
Differing Methodologies and the Value of a Vanilla European Call Option
Load the Package
Create the Instrument
This example shows the value of a vanilla European call option on a dividend-paying equity as a function of time to maturity and the equity price.
As we plot the value of the option as a function of time to maturity and the spot price, the variable S is used to represent the spot price.
Adaptive Integration
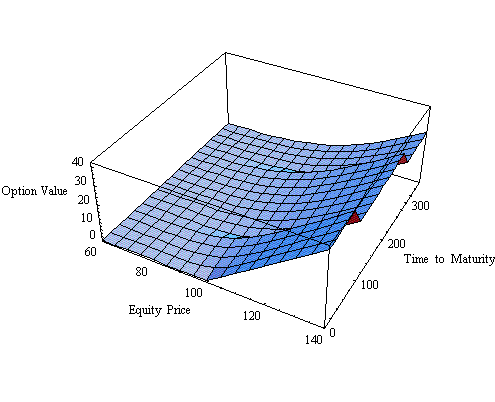
The following picture shows the value of the option as a function of time to maturity and the equity price due to adaptive integration.

Black-Scholes Analytic Valuation
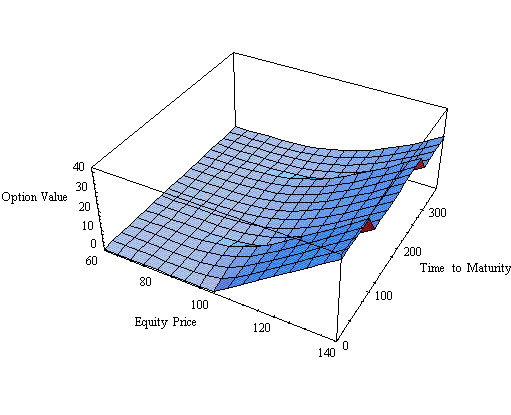
The following picture shows the value of the option as a function of time to maturity and the equity price due to the analytic Black-Scholes formula.

Examining the Difference
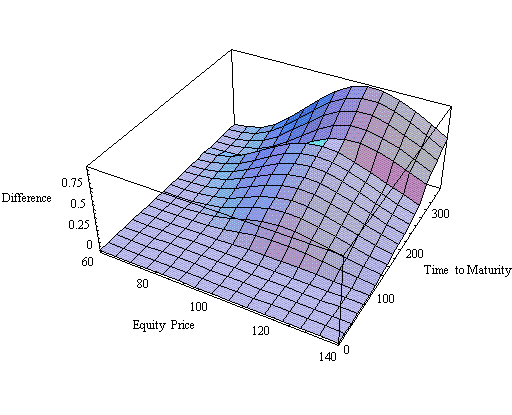
The two plots have the same qualitative behavior. However, in the details there is some difference (as the Black-Scholes value discounts the dividends and therefore does not give the correct result). The following picture shows the difference between the two methods as a function of time to maturity and the equity price.


