Optimice el arranque de una caldera de tambor
La demanda por cambios rápidos en la generación de energía está aumentando, lo cual lleva a la necesidad de arranques rápidos de calderas. Sin embargo, debemos tener cuidado de no calentar una caldera demasiado rápido, ya que esto podría causar fallas en los materiales. Este ejemplo utiliza un modelo de caldera no lineal que captura las propiedades dinámicas clave.
Para ejecutar este ejemplo necesitará
Las versiones más recientes de System Modeler y Mathematica.
Por favor haga una selección:
Obtener unaprueba gratuita Continuar
con la descarga
Modelo de caldera de tambor
El modelo no lineal de caldera de tambor está conectado a una bomba de agua de alimentación, un horno y una válvula en la salida de vapor. Para evitar desbordes de agua dentro de la caldera, es necesario controlar el agua de alimentación para mantener el nivel de agua en su punto fijo.

Modelo completo de caldera de tambor.
Optimice el tiempo de arranque
A medida que se reduce el tiempo de arranque, aumentan las tensiones térmicas que actúan sobre las paredes de la caldera. Las curvas grises discontinuas no están dentro de los límites tolerables de tensión térmica. La siguiente representación muestra que el arranque más rápido ocurre alrededor de los 3000 segundos.
Optimice
Use Wolfram Language para realizar análisis paramétricos.
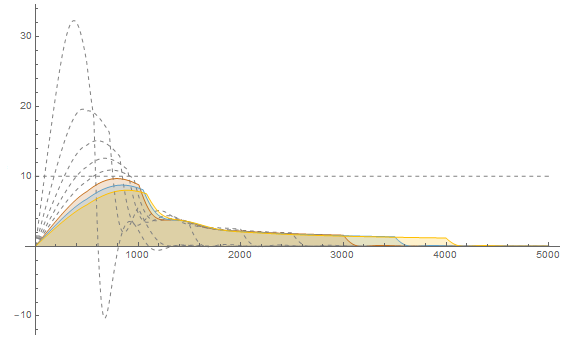
La magnitud de la tensión térmica debe ser menor a 10 para una operación segura.
Simulación usando tiempo de arranque optimizado
La caldera comienza con un volumen inicial de agua y vapor. A medida que se abre la válvula de salida de vapor, el vapor sale de la caldera y se alimenta agua mediante la bomba de agua de alimentación. A medida que se agrega calor a la caldera, el agua se convierte en vapor. Después del arranque, la tasa de evaporación del agua es igual al flujo de entrada de agua de alimentación. El vapor de alta entalpía obtenido de la caldera puede usarse posteriormente para impulsar una turbina y generar electricidad.
El fluido experimenta un cambio de fase.
El agua se convierte en vapor dentro de la caldera.
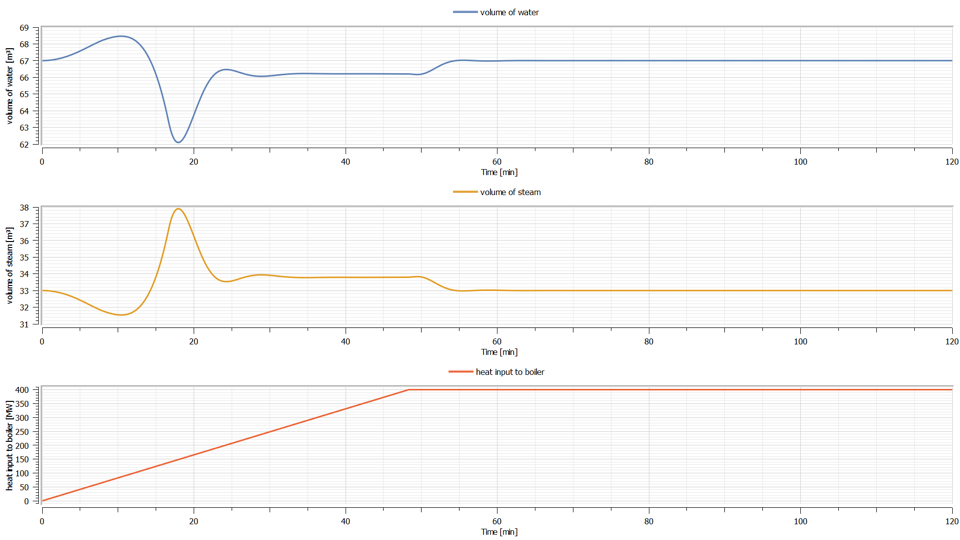
La curva azul en la representación superior muestra el volumen de agua. La curva naranja en la representación intermedia muestra el volumen de vapor. La curva roja en la tercera representación muestra la cantidad de calor añadida por el horno.
Wolfram System Modeler
Probar
Comprar
System Modeler está disponible en inglés
y japonés
para Windows, macOS y Linux »
¿Preguntas? ¿Comentarios? Contacte a un experto de Wolfram »