Columna de cromatografía
La cromatografía es una de las herramientas más importantes tanto para el análisis de mezclas químicas como para su purificación. Las columnas de cromatografía tienen tamaños muy diversos, pero el principio básico que las rige sigue siendo el mismo: que las distintas interacciones moleculares ocasionarán que distintas sustancias fluyan a través de la columna a diferentes velocidades, separándolas de manera efectiva. Este modelo estudia uno de estos tipos de interacción. Se necesita la biblioteca gratuita BioChem de Modelica para ejecutar este ejemplo, y puede descargarla aquí.
Para ejecutar este ejemplo necesitará
Las versiones más recientes de System Modeler y Mathematica.
Por favor haga una selección:
Obtener unaprueba gratuita Continuar
con la descarga
El modelo
Una columna de cromatografía puede describirse como teniendo dos fases: la fase móvil y la fase estacionaria. Las sustancias se moverán entre estas dos fases, sujetas a un equilibrio. Las sustancias en la fase móvil también se desplazarán hacia la parte inferior de la columna. Las ecuaciones diferenciales parciales describen las concentraciones de sustancias de ambas fases en cada punto de la columna. Usando el método de líneas, los puntos espaciales pueden discretizarse, y las ecuaciones diferenciales algebraicas resultantes se pueden resolver numéricamente.
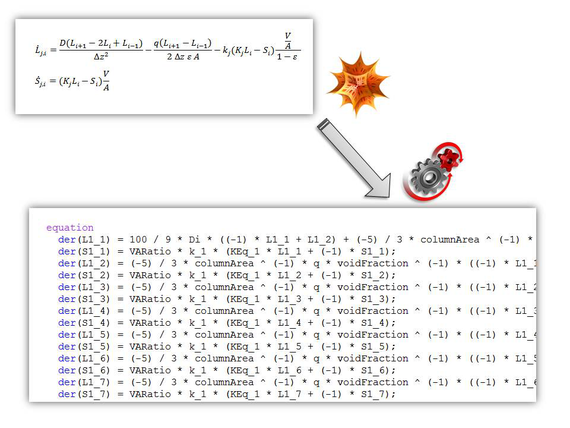
Las ecuaciones diferenciales parciales del modelo se discretizan en Mathematica y son convertidas automáticamente en código de Modelica.
Generación automática de código
Mathematica es capaz de generar y exportar código de Modelica que puede ser simulado directamente en System Modeler.
El ejemplo muestra el uso de la columna de cromatografía para analizar una reacción bioquímica simple modelada con la biblioteca gratuita BioChem de Modelica. Si el eluyente de la columna fuera monitoreado continuamente con un espectrofotómetro, la elución de una sustancia en particular estaría señalada por picos distintivos. Simular el sistema permite analizar el perfil de elución para observar cómo cada sustancia contribuye al perfil.
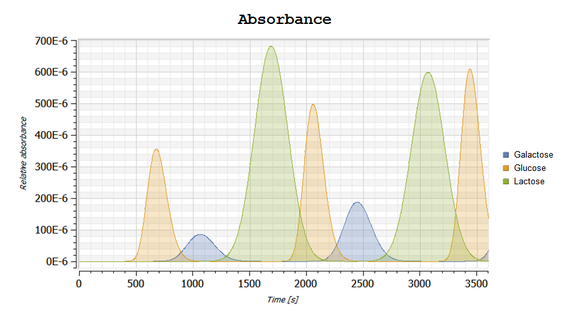
Represente cómo cada una de las sustancias contribuye al perfil de elución.
Interactúe con el sistema
Con los resultados de la simulación importados en Mathematica, es posible visualizar el interior de la columna de cromatografía. Las visualizaciones interactivas pueden implementarse y distribuirse mediante el Formato de documento computable, CDF.
Separación de sustancias dentro de la columna y una representación de cómo cada sustancia contribuye a la señal de salida del espectrofotómetro.
Interactúe con los resultados
Los resultados de System Modeler pueden importarse en Mathematica, donde se pueden realizar análisis adicionales.
Wolfram System Modeler
Probar
Comprar
System Modeler está disponible en inglés
y japonés
para Windows, macOS y Linux »
¿Preguntas? ¿Comentarios? Contacte a un experto de Wolfram »