Ciencias de la vida
Use System Modeler para el modelado y análisis en el descubrimiento de medicamentos, su desarrollo, pruebas clínicas y fabricación. El entorno flexible admite áreas de aplicación tales como biología de sistemas, bioinformática y más.
COVID-19: Study Impact of Policies
During a pandemic, governments implement various policies that typically would decrease the exponential growth rate. This example shows what happens without any policy implementation and how timing is very important. The ambition is not to give any precise numbers, but to make it easier to understand how simple yet at the same time complicated it is to control a pandemic.
Para ejecutar este ejemplo necesitará
Las versiones más recientes de System Modeler y Mathematica.
Por favor haga una selección:
Obtener unaprueba gratuita Continuar
con la descarga
The Model
The COVID-19 model used in this example is based on the SIR (susceptible, infectious, recovered) model. The SIR model was developed by Kermack and McKendrick in the early 1900s and is one of the most well-known models for studying infectious diseases within populations.
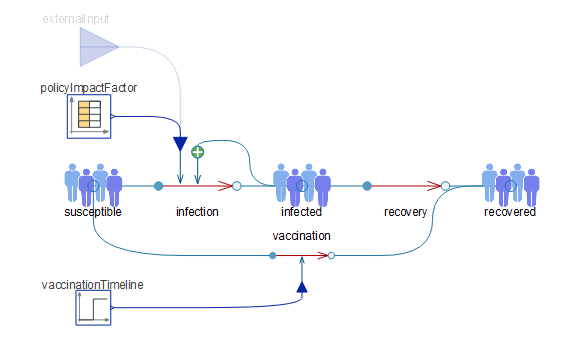
Modified SIR model with vaccination and policy impact factor.
Simulation
The model is simulated for an initial susceptible population of 10 million with 1 person infected. A basic reproduction number (R0) of 2.65 and mean infectious period of 7 days is used. No vaccination is considered.
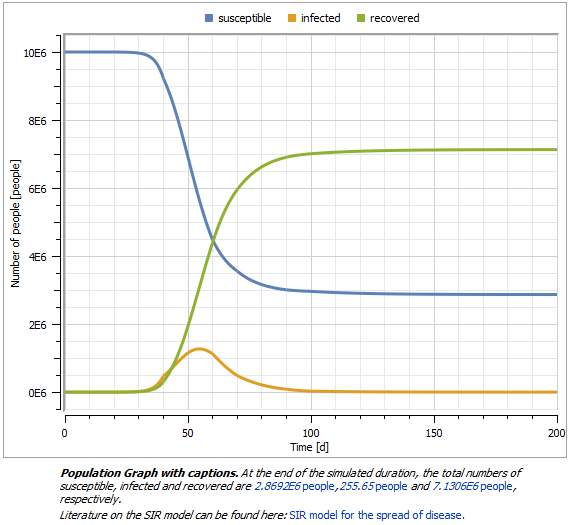
The model is simulated using a custom time unit of days "d". The plot has a caption that displays the values of the susceptible, infected and recovered population at the end of the simulation.
Personalize your plots
Add custom units, model plots and captions to make your plots understandable.
Analysis
Use the locators to introduce policy measures. A policy impact factor represents the effect of measures such as lockdown and social distancing. A value of more than 1 reduces the effective reproduction number (R0hat).
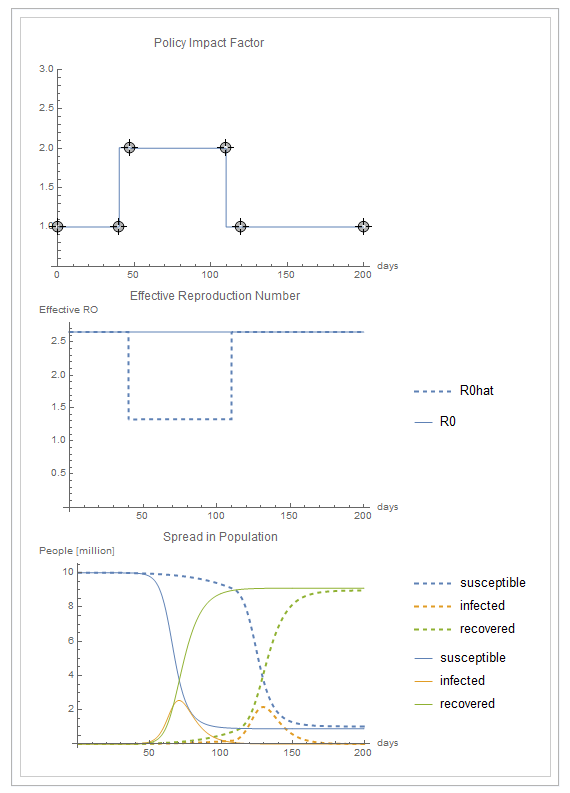
Observe the difference between a no-policy model and a model with policy. The dashed lines represent the results with policy. Explore the COVID-19 Policy Simulator to learn more.
Wolfram System Modeler
Probar
Comprar
System Modeler está disponible en inglés
y japonés
para Windows, macOS y Linux »
¿Preguntas? ¿Comentarios? Contacte a un experto de Wolfram »