‹›Knowledgebase ExpansionAnimate the Rise and Fall of Historical Countries
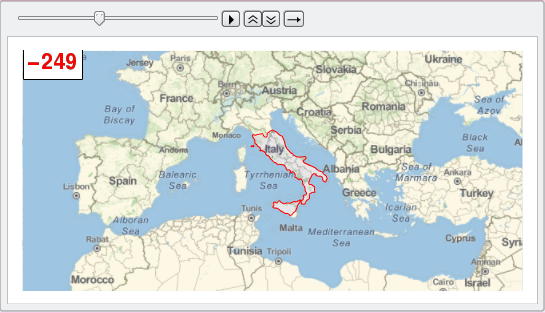
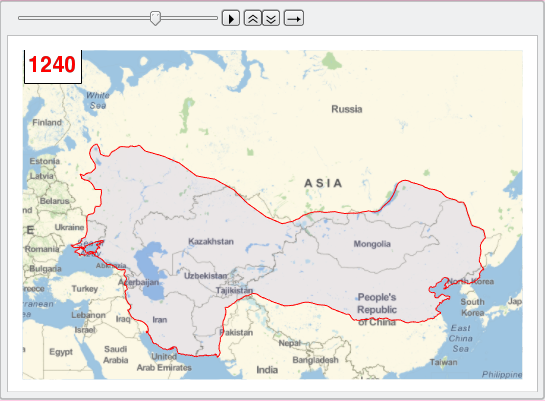
Version 11 includes an extensive collection of polygons for historical country borders, which can be used to visualize the growth (and decline) of many nations and empires.
show complete Wolfram Language input
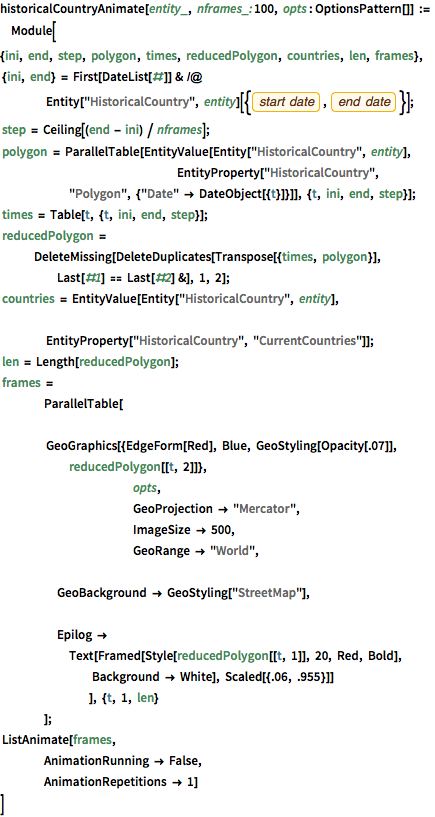
historicalCountryAnimate[entity_, nframes_: 100,
  opts : OptionsPattern[]] := Module[
  {ini, end, step, polygon, times, reducedPolygon, countries, len,
   frames},
   {ini, end} =
   First[DateList[#]] & /@
    Entity["HistoricalCountry",
      entity][{EntityProperty["HistoricalCountry", "StartDate"],
      EntityProperty["HistoricalCountry", "EndDate"]}];
   step = Ceiling[(end - ini) / nframes];
   polygon =
   ParallelTable[EntityValue[Entity["HistoricalCountry", entity],
     				EntityProperty["HistoricalCountry",
      "Polygon", {"Date" -> DateObject[{t}]}]], {t, ini, end, step}];
   times = Table[t, {t, ini, end, step}];
   reducedPolygon =
   DeleteMissing[
    DeleteDuplicates[Transpose[{times, polygon}],
     Last[#1] == Last[#2] &], 1, 2];
   countries = EntityValue[Entity["HistoricalCountry", entity],
    				EntityProperty["HistoricalCountry", "CurrentCountries"]];
   len = Length[reducedPolygon];
   frames =
   	ParallelTable[
    		GeoGraphics[{EdgeForm[Red], Blue, GeoStyling[Opacity[.07]],
      reducedPolygon[[t, 2]]},
     			opts,
     			GeoProjection -> "Mercator",
     			ImageSize -> 500,
     			GeoRange -> "World",
     			GeoBackground -> GeoStyling["StreetMap"],
     			Epilog ->
      Text[Framed[Style[reducedPolygon[[t, 1]], 20, Red, Bold],
        Background -> White], Scaled[{.06, .955}]]
     		], {t, 1, len}
    	];
   ListAnimate[frames,
   	AnimationRunning -> False,
   	AnimationRepetitions -> 1]
]historicalCountryAnimate["RomanRepublic", 100,
GeoRange -> {{30, 50}, {-15, 40}}]historicalCountryAnimate["MongolEmpire", 100,
GeoRange -> {{20, 70}, {20, 140}}]


