Study Illuminance Data Using a Weather Station Device
The following time series is generated by reading illuminance data from a Tinker Forge Weather Station every 0.1 seconds for five seconds while continuously changing the device orientation.
| In[1]:= | X |
Plot the illuminance values.
| In[2]:= | X |
| Out[2]= | 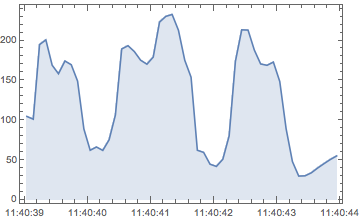 |
Compute the Min, Mean, and Max for the data.
| Out[3]= | 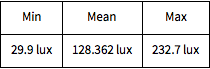 |
Generate illuminance data by alternately switching the ambient light source on and off.
| In[4]:= | X |
A plot of the time series reveals the approximate periodic nature of the data.
| In[5]:= | X |
| Out[5]= | 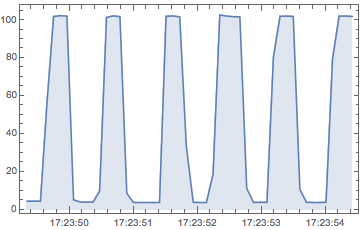 |
Verify the periodicity using Fourier.
| In[6]:= | X |
| In[7]:= | X |
| Out[7]= | 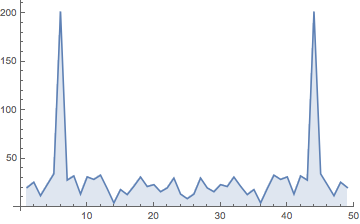 |