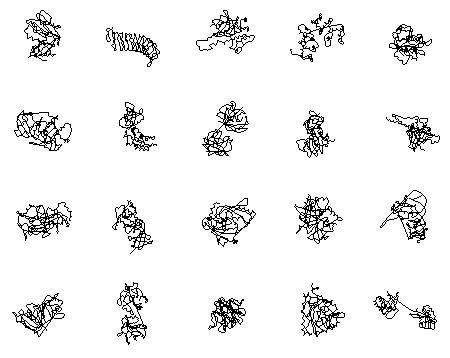
GraphicsGrid[Partition[

  Graphics3D[

     {Black, Thickness[0.01],

      BezierCurve[

       ProteinData[#, "AtomPositions", "Residue"][[All, 2]]]},

     Boxed -> False,

     ImageSize -> 100

     ] & /@ {"NEDD8", "RTN4R", "SLK", "GGA2", "PDXP", "SENP8", "TRIO",

     "PPIF", "TDG", "E2F1", "MMP3", "PLK1", "UBE2S", "F2", "ETS1",

    "PDE6D", "GPX7", "SOD1", "PAH", "RAB21"}, 5], ImageSize -> 500]