New in Wolfram Mathematica 7: Integrated Genomic & Protein Data  previous | next 
Display Protein Conformations as Curves
Show the conformation of a protein backbone using Tube and BezierCurve.
In[1]:=

Click for copyable input
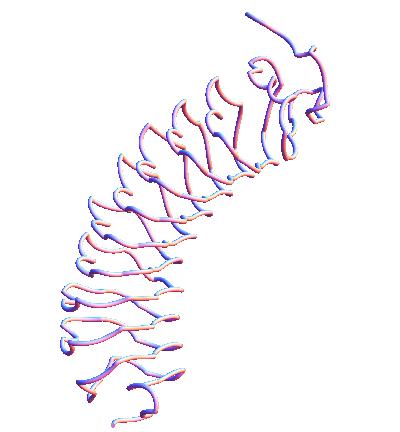
Graphics3D[

 {Tube@BezierCurve[

    ProteinData["RTN4R", "AtomPositions", "Residue"][[All, 2]]]},

 Boxed -> False,

 ImageSize -> 400

 ]
Out[1]=