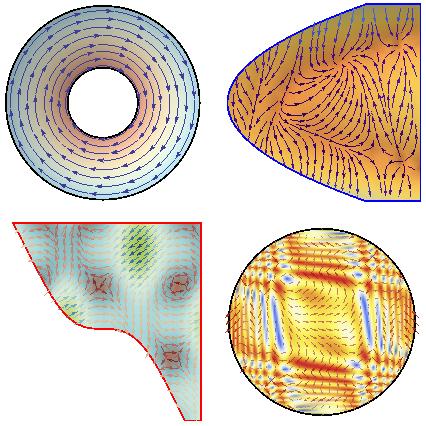
GraphicsGrid[{{StreamDensityPlot[{y, -x}, {x, -2, 2}, {y, -2, 2},

    RegionFunction -> Function[{x, y}, 0.55 < x^2 + y^2 < 4.2],

    ColorFunction -> "RedBlueTones", Frame -> False,

    StreamScale -> Medium, ImageSize -> Medium,

    LightingAngle -> Automatic, BoundaryStyle -> {Black, Thick}],

   StreamDensityPlot[{Cos[x^2 + y], 1 + x - y^2}, {x, -3, 3}, {y, -3,

     3}, ColorFunction -> "BeachColors",

    StreamColorFunction -> "DeepSeaColors", StreamStyle -> Black,

    StreamScale -> {Automatic, Automatic, Scaled[0.8]},

    Frame -> False, LightingAngle -> Automatic,

    RegionFunction -> Function[(#1 + 3) >= 0.45 #2^2],

    BoundaryStyle -> {Blue, Thick}]}, {VectorDensityPlot[{Cos[y] -

      Sin[x]^3, -.1 y - Sin[x]}, {x, -4, 4}, {y, -4, 4},

    Frame -> False, VectorScale -> {0.05, Automatic, None},

    VectorPoints -> 25, AspectRatio -> Automatic,

    ColorFunction -> "IslandColors",

    VectorColorFunction -> "RedBlueTones",

    BoundaryStyle -> {Red, Thick},

    RegionFunction -> Function[#2 + #1 + 0.3 >= Sin[#1]]],

   VectorDensityPlot[{Cos[x + y^3], Sin[y + x^3]}, {x, -3, 3}, {y, -3,

      3}, Frame -> False, ColorFunction -> "TemperatureMap",

    VectorScale -> {Automatic, Automatic, Automatic},

    RegionFunction -> Function[#1^2 + #2^2 <= 9],

    BoundaryStyle -> Thick, MaxRecursion -> 2,

    VectorColorFunction -> "RoseColors", VectorPoints -> Fine]}}]