New in Wolfram Mathematica 7: Vector & Field Visualization  previous | next 
Plot the Density and Mesh and Overlay Streamlines
Plot the density of a function and overlay its gradient streamlines.
In[1]:=

Click for copyable input
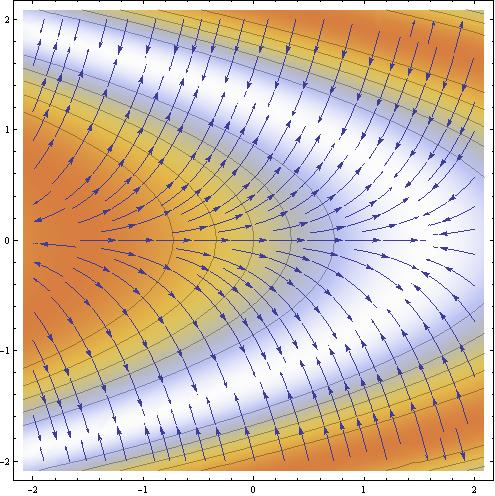
f = Sin[x + y^2];

gradient = D[f, {{x, y}}];
In[2]:=

Click for copyable input
StreamDensityPlot[{gradient, f}, {x, -2, 2}, {y, -2, 2}, Mesh -> 5, 

 ColorFunction -> "BeachColors", MaxRecursion -> 1]
Out[2]=