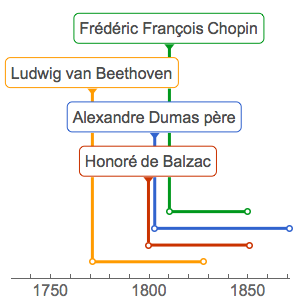
Disposition de la chronologie et emplacement des étiquettes
Créez des chronologies pour les personnes célèbres de la période romantique.
In[1]:=
romanticerapeople =
  DeleteCases[
   EntityValue[
    Entity["HistoricalPeriod", "RomanticEra"][
     "PeopleInvolved"], {"BirthDate", "DeathDate", "Name", "Image",
     "Occupation"}], {__, _Missing}];
In[2]:=
lifespan =
  GroupBy[romanticerapeople,
   Last -> (Tooltip[
       Labeled[Interval@#[[1 ;; 2]], #[[3]], "StartBubble"],
       Labeled[#[[4]], DateDifference[#[[1]], #[[2]], "Year"]]] &)];
Affichez chaque compositeur sur sa propre rangée.
In[3]:=
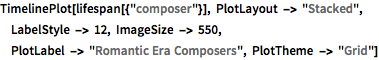
TimelinePlot[lifespan[{"composer"}], PlotLayout -> "Stacked",
 LabelStyle -> 12, ImageSize -> 550,
 PlotLabel -> "Romantic Era Composers", PlotTheme -> "Grid"]
Out[3]=

Utilisez le nombre minimal de rangées.
In[4]:=
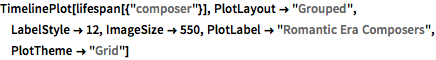
TimelinePlot[lifespan[{"composer"}], PlotLayout -> "Grouped",
 LabelStyle -> 12, ImageSize -> 550,
 PlotLabel -> "Romantic Era Composers", PlotTheme -> "Grid"]
Out[4]=

Placez l'étiquette à la fin de l'intervalle de temps.
In[5]:=

lifespan =
  GroupBy[romanticerapeople,
   Last -> (Tooltip[
       Labeled[Interval@#[[1 ;; 2]], #[[3]], "EndBubble"],
       Labeled[#[[4]], DateDifference[#[[1]], #[[2]], "Year"]]] &)];
In[6]:=
TimelinePlot[lifespan[{"composer"}], LabelStyle -> 12,
 ImageSize -> 550, PlotLabel -> "Romantic Era Composers",
 PlotTheme -> "Grid"]
Out[6]=

Lorsqu'il y a beaucoup d'entrées de données et que l'espace est limité, placez les étiquettes après les intervalles.
In[7]:=
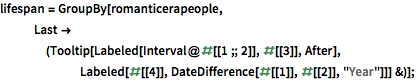
lifespan =
  GroupBy[romanticerapeople,
   Last -> (Tooltip[Labeled[Interval@#[[1 ;; 2]], #[[3]], After],
       Labeled[#[[4]], DateDifference[#[[1]], #[[2]], "Year"]]] &)];
In[8]:=
TimelinePlot[Values@lifespan, PlotLayout -> "Grouped",
 LabelStyle -> 14, AspectRatio -> 1/1.2, ImageSize -> 450,
 PlotLegends ->
  LineLegend[Flatten@Keys[lifespan],
   LegendLayout -> "ReversedColumn"], PlotTheme -> "Web"]
Out[8]=

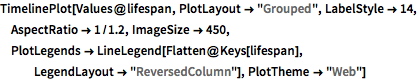
Utilisez une mise en page compacte pour tous les jeux de données.
In[9]:=
TimelinePlot[Values@lifespan, PlotLayout -> "Packed",
 LabelStyle -> 14, AspectRatio -> 1/1.2, ImageSize -> 450,
 PlotLegends ->
  LineLegend[Flatten@Keys[lifespan],
   LegendLayout -> "ReversedColumn"], PlotTheme -> "Web"]
Out[9]=