Add Graphical Labels in TimelinePlot
Show the release dates of all the Harry Potter movies.
In[1]:=
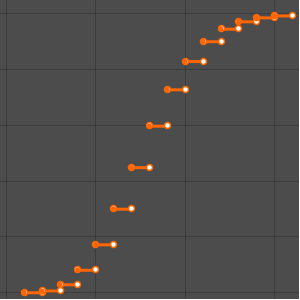
TimelinePlot[
 EntityClass["Movie", "HarryPotterFranchise"] -> "ReleaseDate"]
Out[1]=

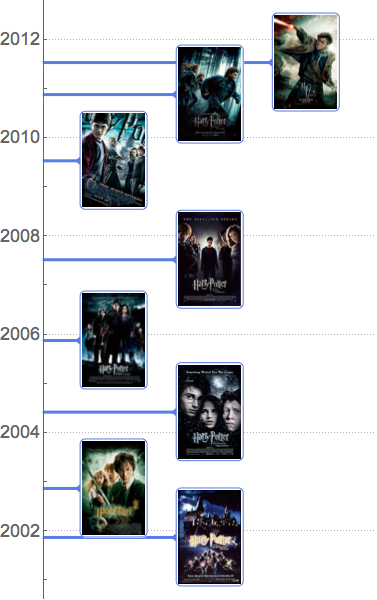
Use the movie posters as labels and plot them in a vertical timeline with the oldest movies at the bottom.
In[2]:=
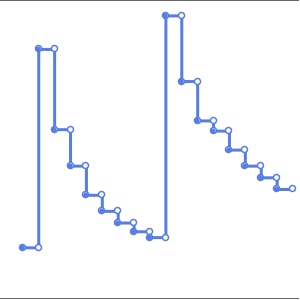
TimelinePlot[
 Rule @@@ EntityValue[
   EntityClass["Movie", "HarryPotterFranchise"], {"ReleaseDate",
    "Image"}], LabelStyle -> 18, PlotLayout -> "ReverseVertical",
 PlotTheme -> "Business"]
Out[2]=