Visualize Time Events with TimelinePlot
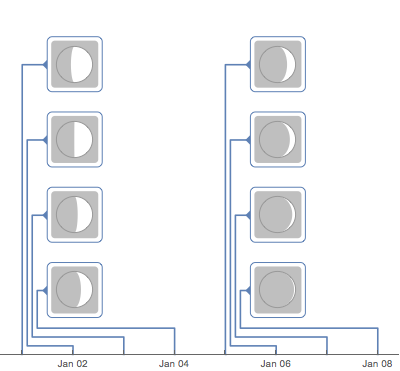
By default, timelines will align groups of labels.
In[1]:=
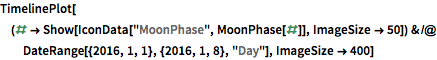
TimelinePlot[(# ->
     Show[IconData["MoonPhase", MoonPhase[#]], ImageSize -> 50]) & /@
  DateRange[{2016, 1, 1}, {2016, 1, 8}, "Day"], ImageSize -> 400]
Out[1]=
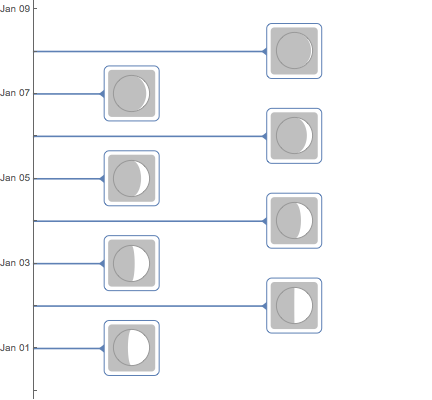
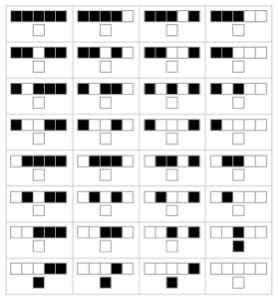
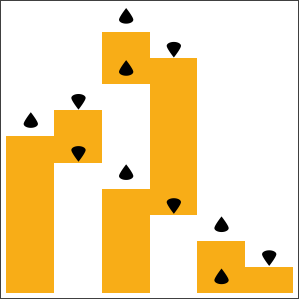
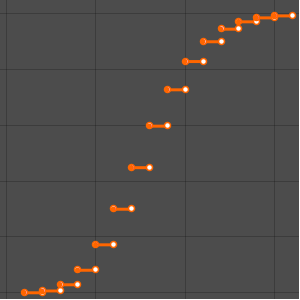
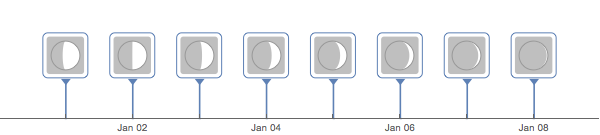
Distribute the labels horizontally.
In[2]:=
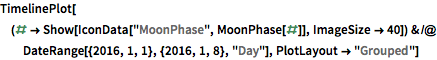
TimelinePlot[(# ->
     Show[IconData["MoonPhase", MoonPhase[#]], ImageSize -> 40]) & /@
  DateRange[{2016, 1, 1}, {2016, 1, 8}, "Day"],
 PlotLayout -> "Grouped"]
Out[2]=
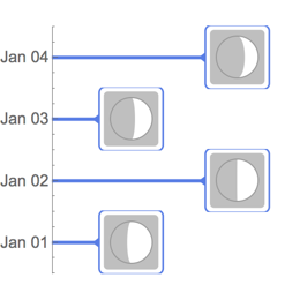
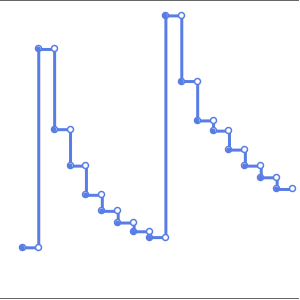
The label placements automatically adjust to the layout of the timeline.
In[3]:=
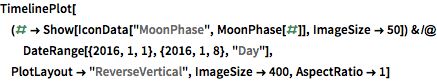
TimelinePlot[(# ->
     Show[IconData["MoonPhase", MoonPhase[#]], ImageSize -> 50]) & /@
  DateRange[{2016, 1, 1}, {2016, 1, 8}, "Day"],
 PlotLayout -> "ReverseVertical", ImageSize -> 400, AspectRatio -> 1]
Out[3]=