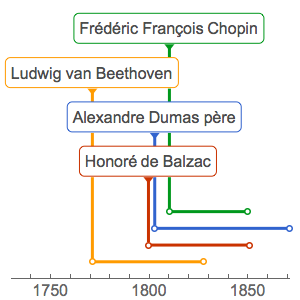
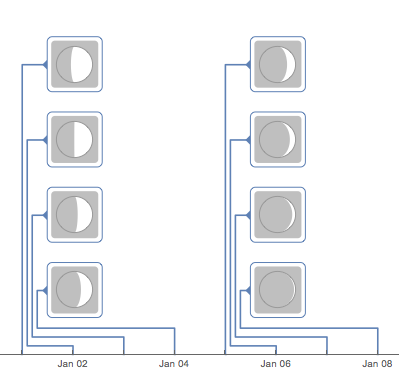
Visualice eventos de tiempo con TimelinePlot
De forma predeterminada, las líneas de tiempo se alineará con grupos de etiquetas.
In[1]:=
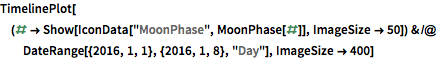
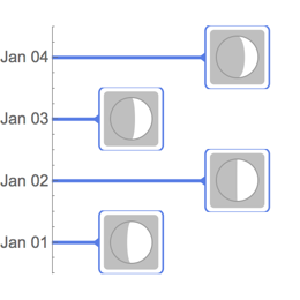
TimelinePlot[(# ->
     Show[IconData["MoonPhase", MoonPhase[#]], ImageSize -> 50]) & /@
  DateRange[{2016, 1, 1}, {2016, 1, 8}, "Day"], ImageSize -> 400]
Out[1]=
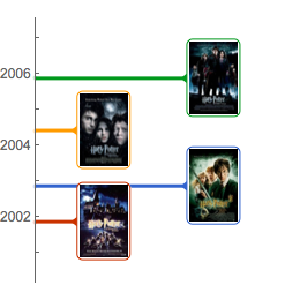
Distribuya las etiquetas de forma horizontal.
In[2]:=
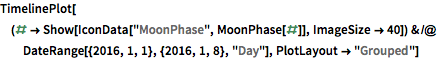
TimelinePlot[(# ->
     Show[IconData["MoonPhase", MoonPhase[#]], ImageSize -> 40]) & /@
  DateRange[{2016, 1, 1}, {2016, 1, 8}, "Day"],
 PlotLayout -> "Grouped"]
Out[2]=

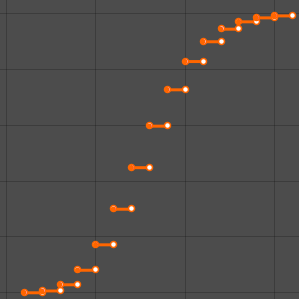
Las colocaciones de las etiquetas se ajustarán automáticamente a la disposición de la línea de tiempo.
In[3]:=
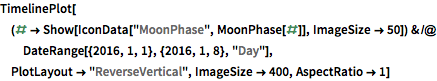
TimelinePlot[(# ->
     Show[IconData["MoonPhase", MoonPhase[#]], ImageSize -> 50]) & /@
  DateRange[{2016, 1, 1}, {2016, 1, 8}, "Day"],
 PlotLayout -> "ReverseVertical", ImageSize -> 400, AspectRatio -> 1]
Out[3]=