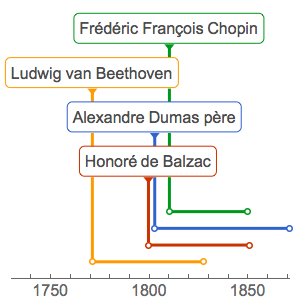
利用 TimelinePlot 可视化时间事件
缺省情况下,时间线上的标签按组对齐.
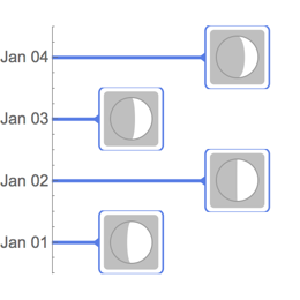
In[1]:=
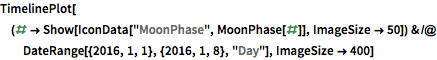
TimelinePlot[(# ->
     Show[IconData["MoonPhase", MoonPhase[#]], ImageSize -> 50]) & /@
  DateRange[{2016, 1, 1}, {2016, 1, 8}, "Day"], ImageSize -> 400]
Out[1]=

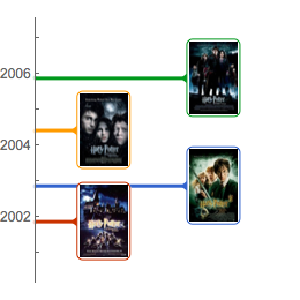
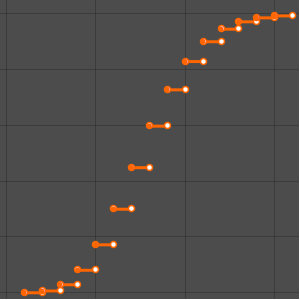
水平排放标签.
In[2]:=
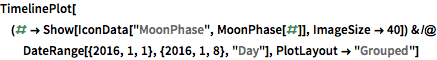
TimelinePlot[(# ->
     Show[IconData["MoonPhase", MoonPhase[#]], ImageSize -> 40]) & /@
  DateRange[{2016, 1, 1}, {2016, 1, 8}, "Day"],
 PlotLayout -> "Grouped"]
Out[2]=

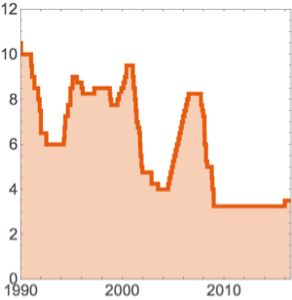
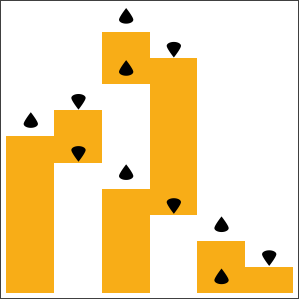
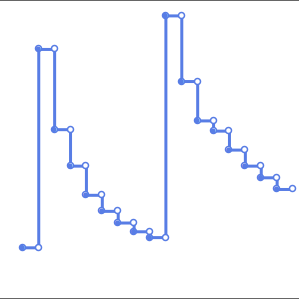
根据时间线的布局自动调整标签放置的位置.
In[3]:=
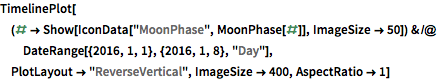
TimelinePlot[(# ->
     Show[IconData["MoonPhase", MoonPhase[#]], ImageSize -> 50]) & /@
  DateRange[{2016, 1, 1}, {2016, 1, 8}, "Day"],
 PlotLayout -> "ReverseVertical", ImageSize -> 400, AspectRatio -> 1]
Out[3]=