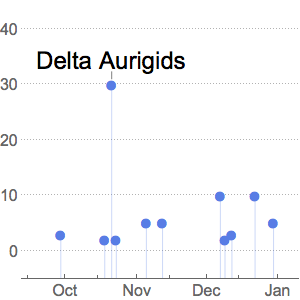
데이터의 자동 분류
ListPlot과 관련 함수는 LabelingFunction의 지원을 시작하였습니다.
전체 Wolfram 언어 입력 표시하기
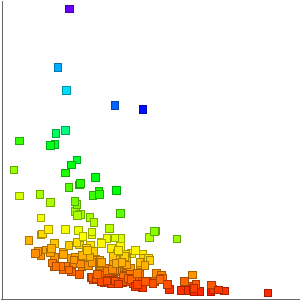
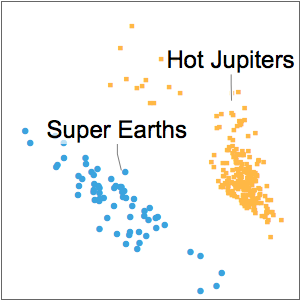
적절한 메타 데이터가 존재하는 경우 LabelingFunction은 자동으로 이것을 라벨로 사용합니다.
In[2]:=
months = {"Jan", "Feb", "Mar", "Apr", "May", "Jun", "Jul", "Aug",
   "Sep", "Oct", "Nov", "Dec"};
In[3]:=
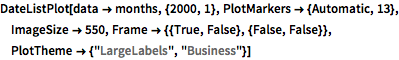
DateListPlot[data -> months, {2000, 1},
 PlotMarkers -> {Automatic, 13}, ImageSize -> 550,
 Frame -> {{True, False}, {False, False}},
 PlotTheme -> {"LargeLabels", "Business"}]
Out[3]=
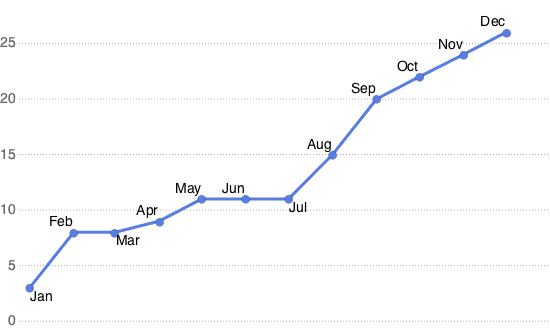
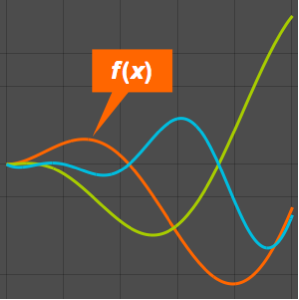
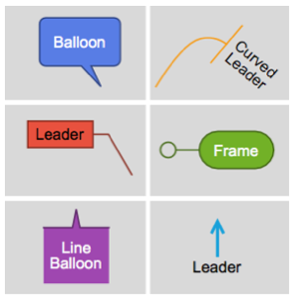
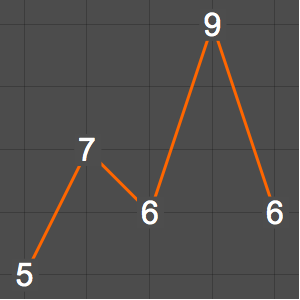
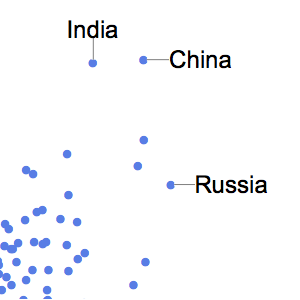
LabelingFunction에서 Callout을 사용합니다.
In[4]:=
DateListPlot[data -> months, {2000, 1},
 LabelingFunction -> Callout[ Automatic, Automatic],
 PlotMarkers -> {Automatic, 13}, ImageSize -> 550,
 Frame -> {{True, False}, {False, False}},
 PlotTheme -> {"LargeLabels", "Business"}]
Out[4]=
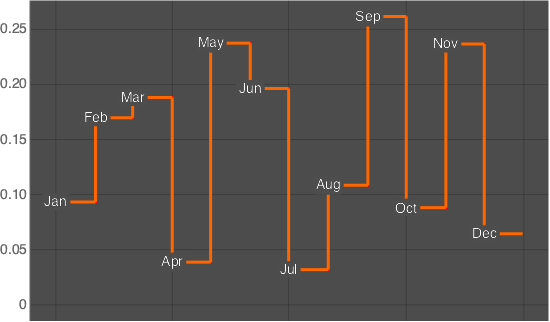
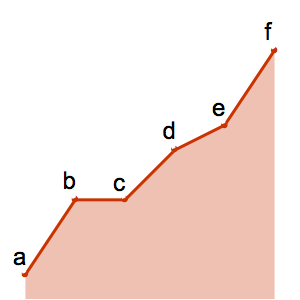
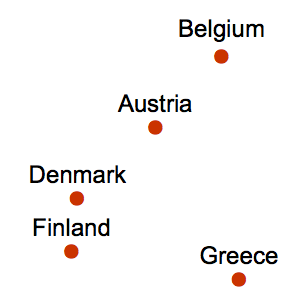
데이터의 중심에 라벨을 위치시킵니다.
In[5]:=
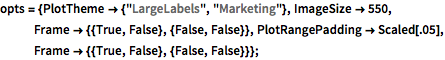
opts = {PlotTheme -> {"LargeLabels", "Marketing"}, ImageSize -> 550,
   Frame -> {{True, False}, {False, False}},
   PlotRangePadding -> Scaled[.05],
   Frame -> {{True, False}, {False, False}}};
In[6]:=
SeedRandom[4]; DateListStepPlot[
 RandomReal[{0, 0.3}, 12] -> months, {2000, 1},
 LabelingFunction -> Center, opts]
Out[6]=