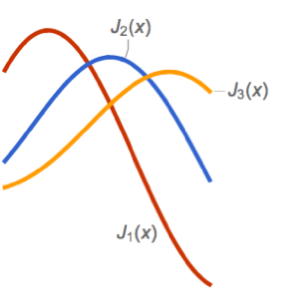
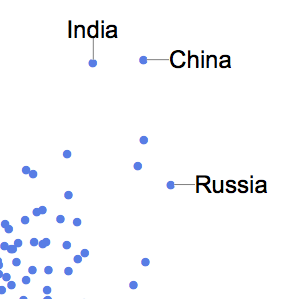
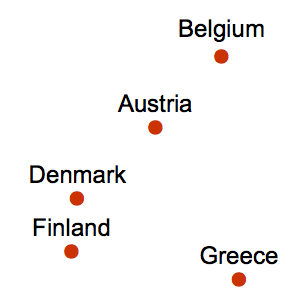
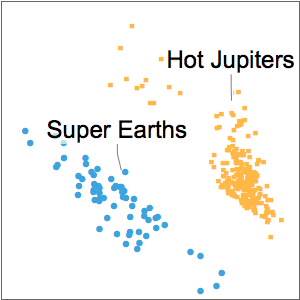
Mehrere Callouts
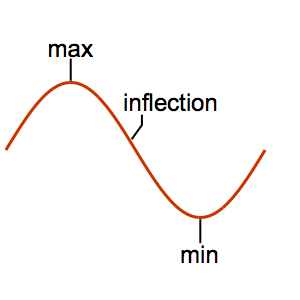
Callouts können verwendet werden, um das Maximum und Minimun einer Kurve zu beschriften.
In[1]:=
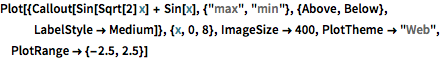
Plot[{Callout[Sin[Sqrt[2] x] + Sin[x], {"max", "min"}, {Above, Below},
    LabelStyle -> Medium]}, {x, 0, 8}, ImageSize -> 400,
 PlotTheme -> "Web", PlotRange -> {-2.5, 2.5}]
Out[1]=

Versehen Sie jeden Punkt eines Diagramms mit einem Callout.
In[2]:=
ListLinePlot[{Table[Callout[{i, Sin[i/2]}, i, Below], {i, 0, 10, 1}]},
  PlotTheme -> "Business"]
Out[2]=