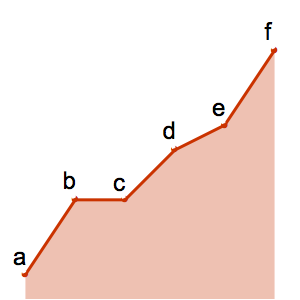
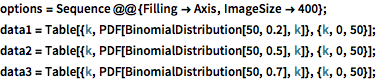
Coloque etiquetas relativas a los datos
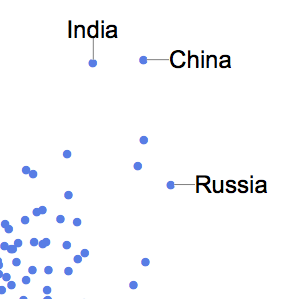
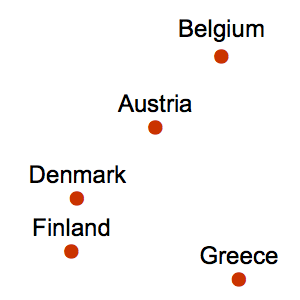
Callout y Labeled pueden ser colocadas en locaciones nombradas en relación con los datos.
muestre la entrada completa de Wolfram Language
In[2]:=
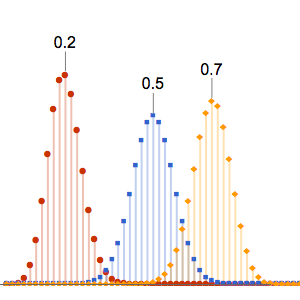
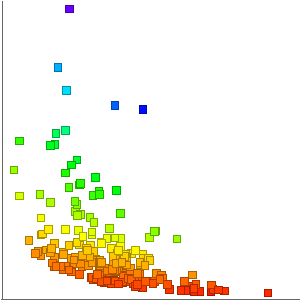
ListPlot[{Callout[data1, "0.2", Above], Callout[data2, "0.5", Above],
  Callout[data3, "0.7", Above]}, options]
Out[2]=

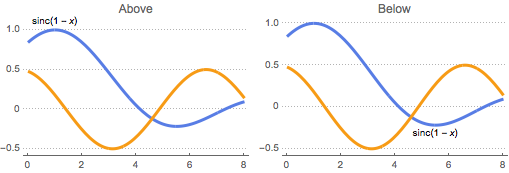
In[3]:=
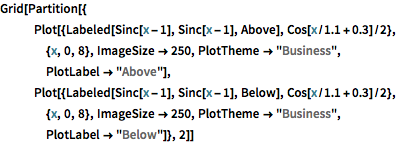
Grid[Partition[{
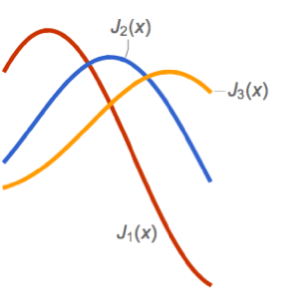
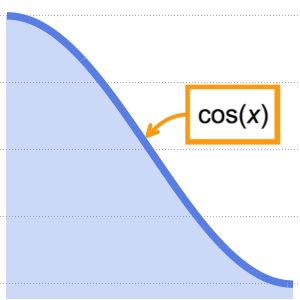
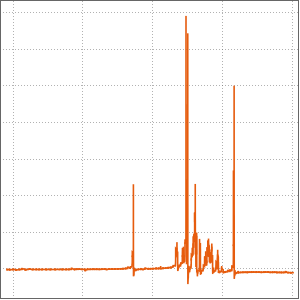
Plot[{Labeled[Sinc[x - 1], Sinc[x - 1], Above],
Cos[x/1.1 + 0.3]/2}, {x, 0, 8}, ImageSize -> 250,
PlotTheme -> "Business", PlotLabel -> "Above"],
Plot[{Labeled[Sinc[x - 1], Sinc[x - 1], Below],
Cos[x/1.1 + 0.3]/2}, {x, 0, 8}, ImageSize -> 250,
PlotTheme -> "Business", PlotLabel -> "Below"]}, 2]]Out[3]=
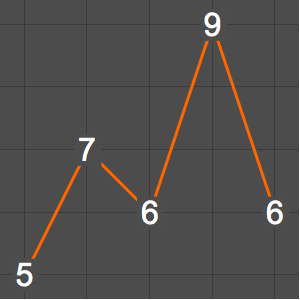
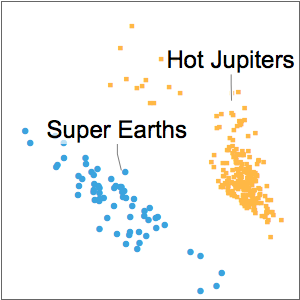
Una posición puede ser usada como una función LabelingFunction para automáticamente colocar etiquetas.
In[4]:=
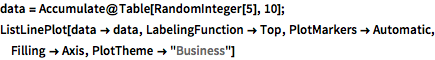
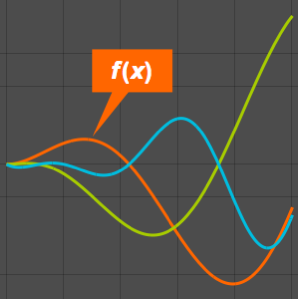
data = Accumulate@Table[RandomInteger[5], 10];
ListLinePlot[data -> data, LabelingFunction -> Top,
 PlotMarkers -> Automatic, Filling -> Axis, PlotTheme -> "Business"]
Out[4]=