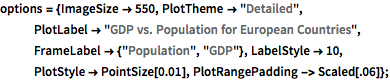
Sistema de etiquetado con atributos de puntos
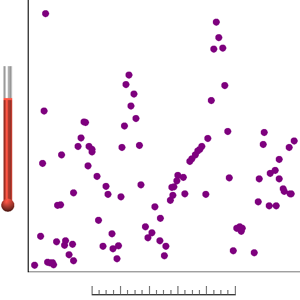
El etiquetado de puntos dispersos con etiquetas de varias longitudes puede ser difícil si se hace manualmente. El nuevo sistema de etiquetado proporciona una solución automática.
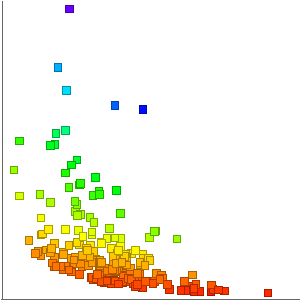
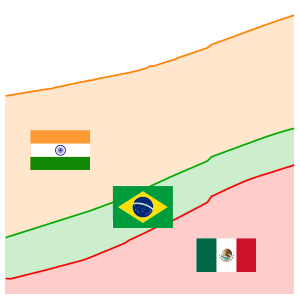
Aquí hay un ejemplo de un gráfico del PIB versus población para todos los países europeos.
muestre la entrada completa de Wolfram Language
In[2]:=
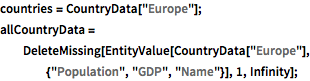
countries = CountryData["Europe"];
allCountryData =
DeleteMissing[
EntityValue[CountryData["Europe"], {"Population", "GDP", "Name"}],
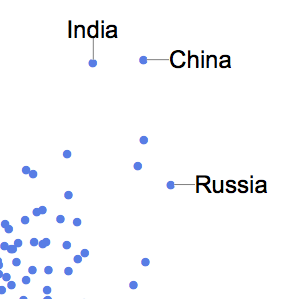
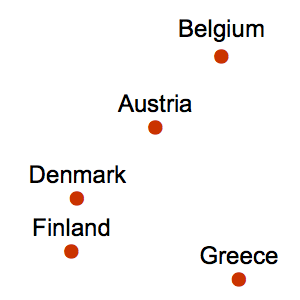
1, Infinity];Muestre 20 ejemplos con etiquetado automático de atributos de puntos.
In[3]:=
ListLogLogPlot[
 allCountryData[[1 ;; 20, {1, 2}]] ->
  allCountryData[[1 ;; 20, 3]], options]
Out[3]=

Cuando los puntos están muy concentrados y hay muchos, combinar etiquetas con una leyenda puede funcionar bien.
In[4]:=
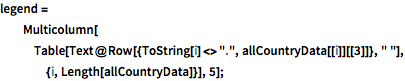
legend = Multicolumn[
   Table[Text@
     Row[{ToString[i] <> ".", allCountryData[[i]][[3]]}, " "], {i,
     Length[allCountryData]}], 5];
In[5]:=
Legended[ListLogLogPlot[allCountryData[[All, {1, 2}]],
  LabelingFunction -> (First@#2 &), options], Placed[legend, Bottom]]
Out[5]=