GeoBubbleChart Labeling
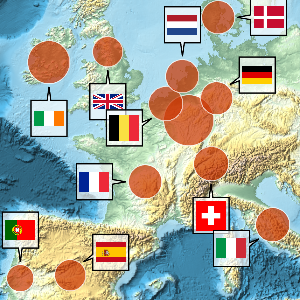
Show a map of Europe with bubbles scaled according to the GDP per person employed. Callouts are displayed when there is room for them.
Using smaller labels, such as country codes instead of names, allows more labels to fit, including inside larger bubbles.
Style the callouts using a balloon appearance so they stand out better.