Wolfram地理学Wolfram 语言
的核心内容
分析、计算和可视化地理数据。
通过精选地理数据、精确计算和自动可视化,使地理学内容变得可计算。无论是初学者还是专家,都可以轻松地将您的数据转换为直观且精美的地图。
丰富的地理背景
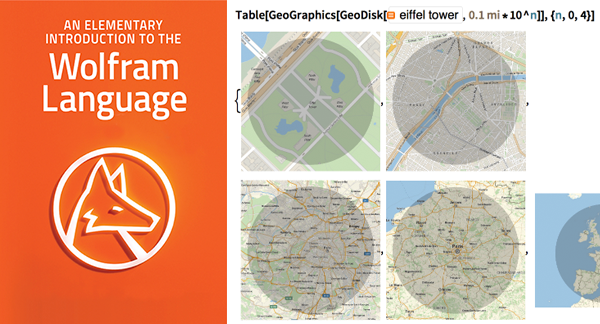
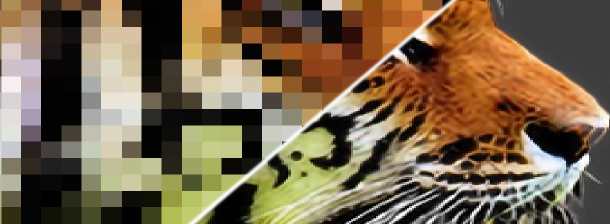
为背景、方位和研究发现提供各种不同的地图类型。可从街道地图、高程图、等高线图、卫星图像等中进行选择。可以在 150 多种不同的投影中使用覆盖全球、高分辨率的特色地点以及高质量的向量和光栅渲染。
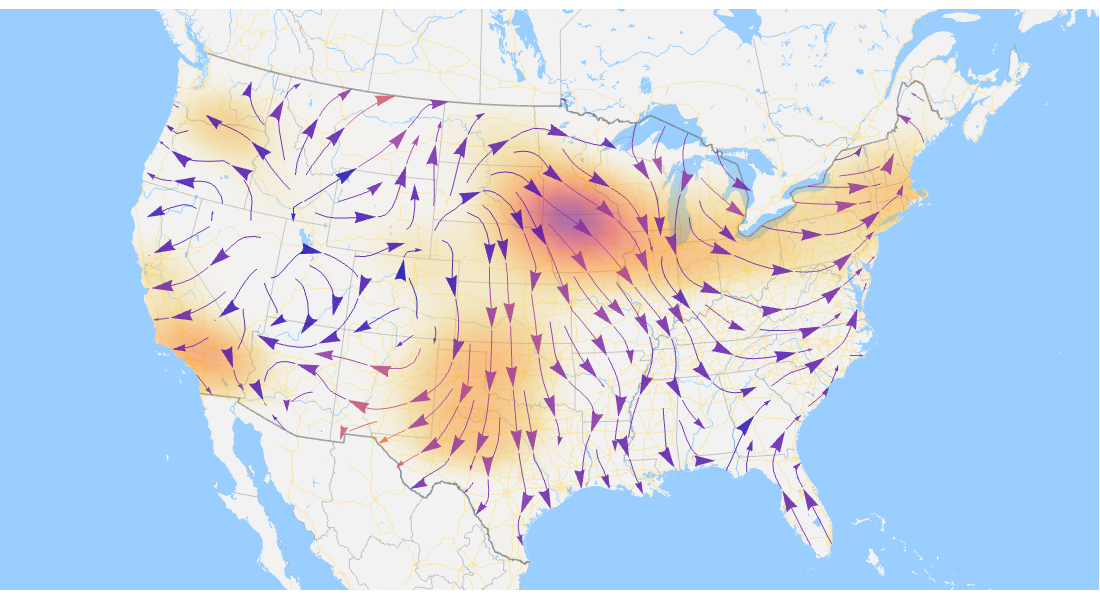
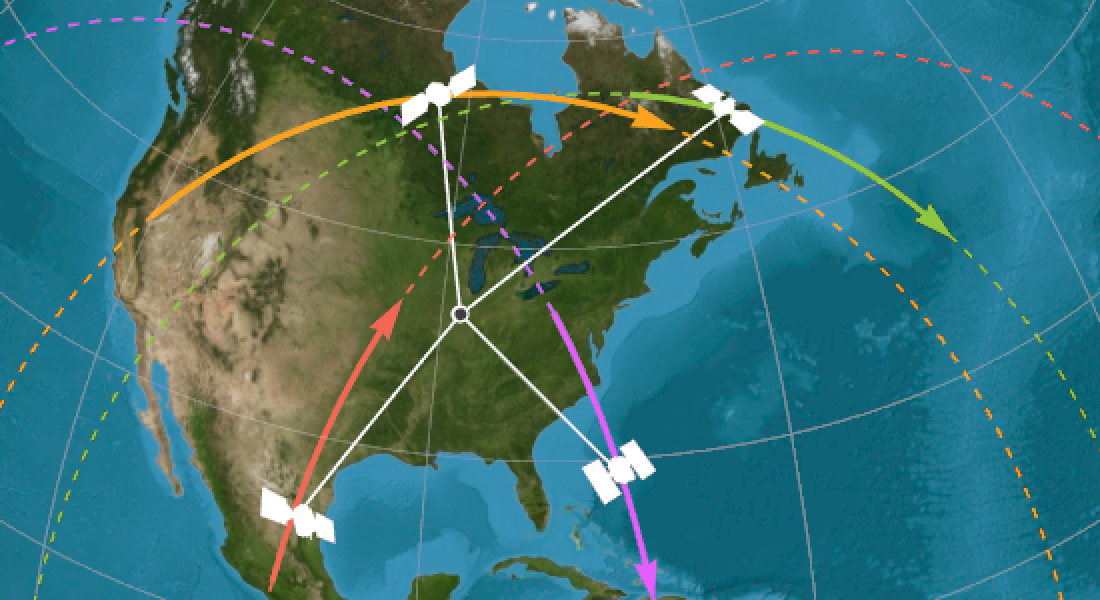
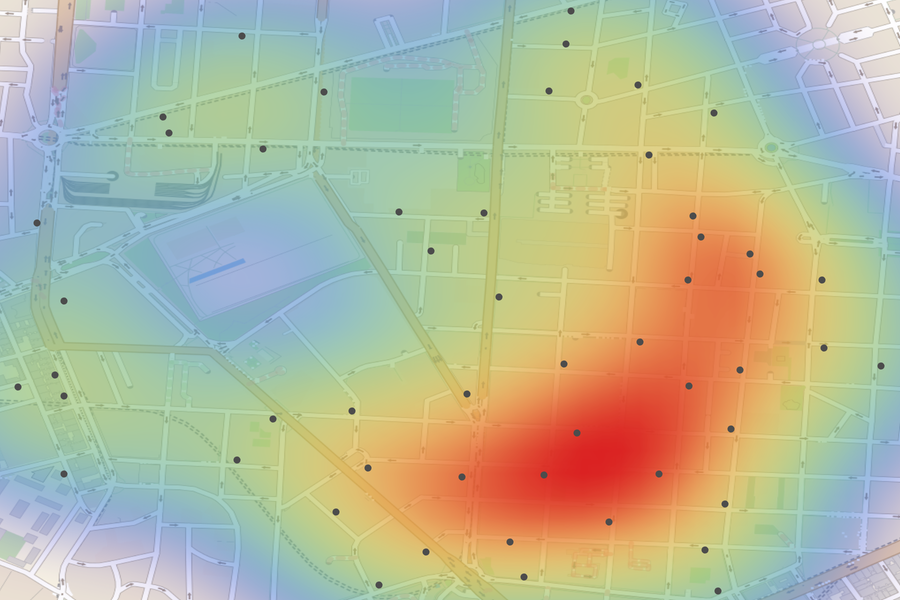
地理可视化
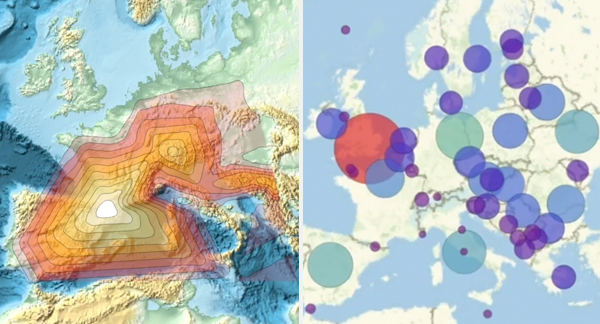
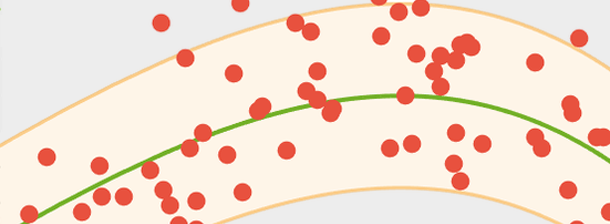
回答“哪里”以及“为什么”这样的问题。在地图上叠加标量、向量、图和密度数据,以便立即从空间上洞察哪里发生了什么。基于强大的地理计算、自动可视化和广搏的知识库构建丰富且易于使用的地理可视化。
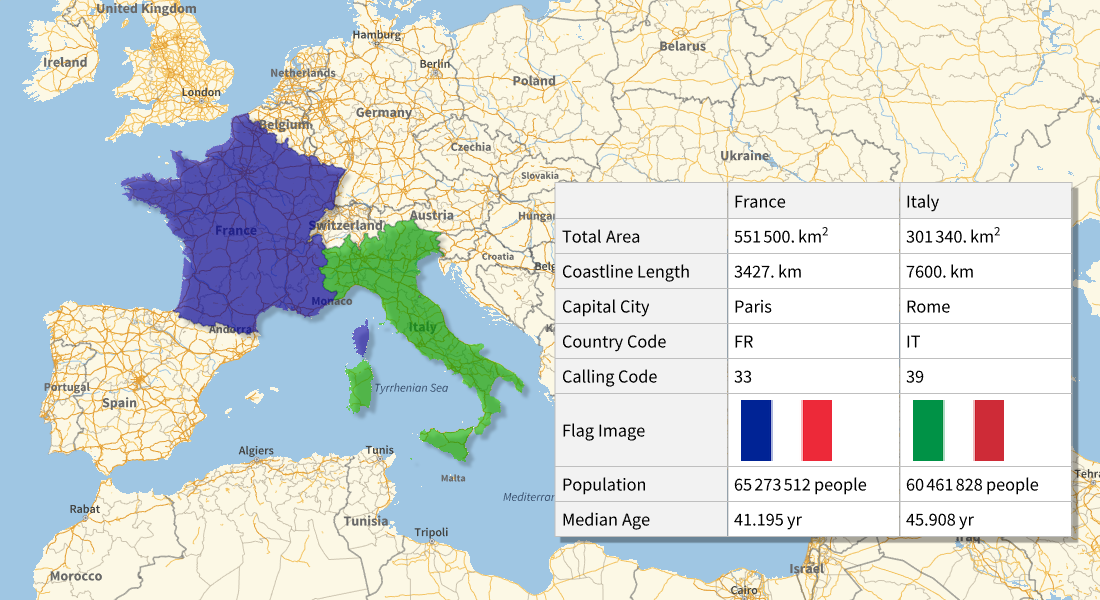
地理数据
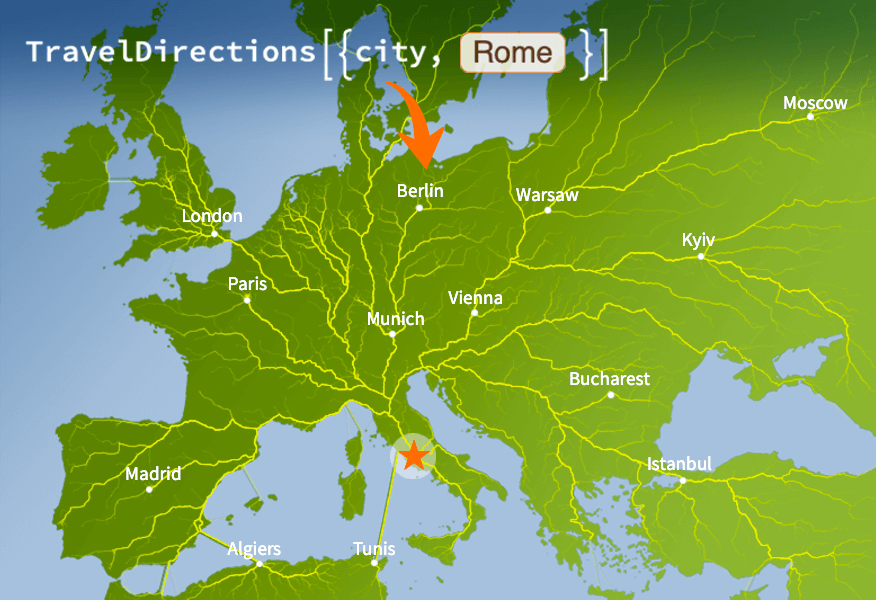
用相关的、最新的、已经对地理内容标记过的信息改进和扩展您的地图。以简单、一致和系统的方式立即访问精选的社会经济和历史数据;地球物理和天气信息;行政边界、河流或道路。
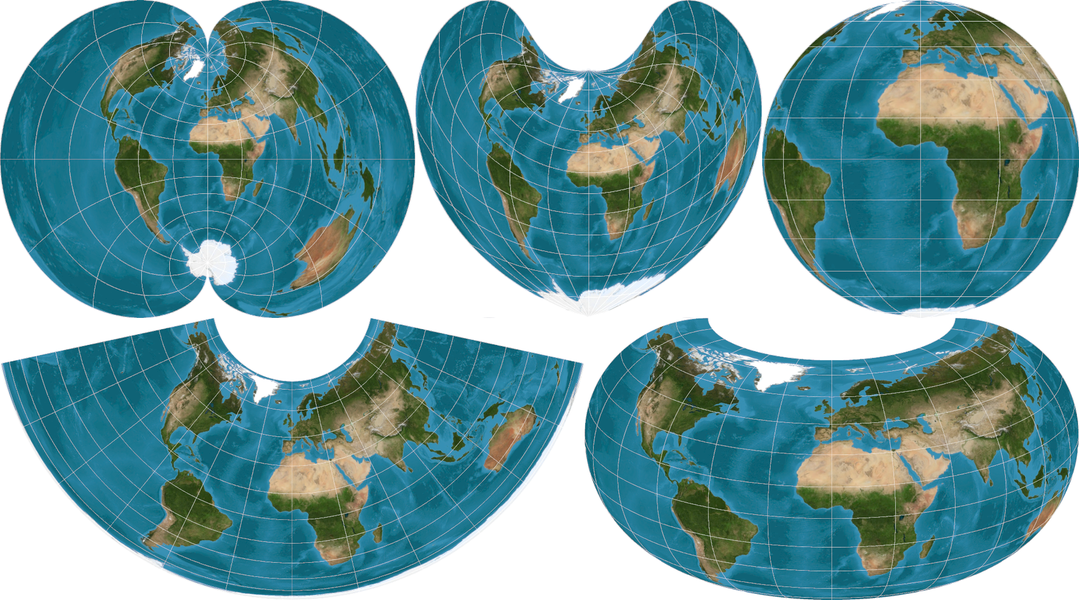
地理投影
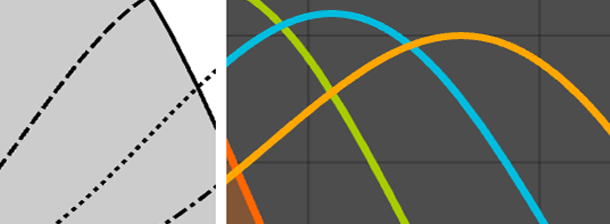
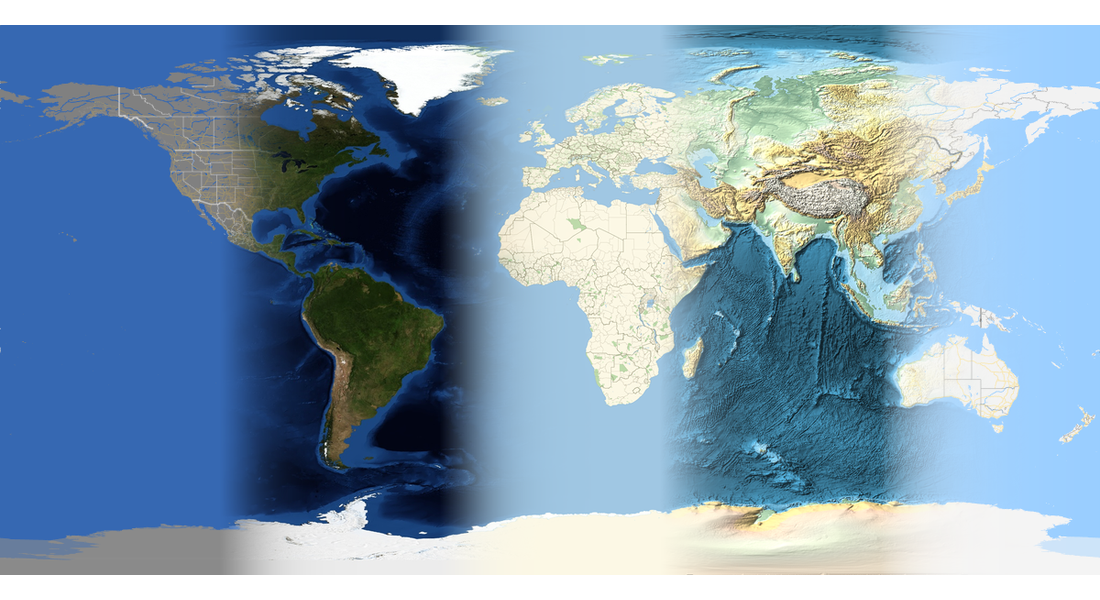
以 150 多种不同方式将地球投射到屏幕上。制作着重于数据不同特征(距离、方向、面积、...)的地图。指定居中、比例尺和其他参数,为您的地图选择最合适的投影,也可让 GeoGraphics 为您选择。
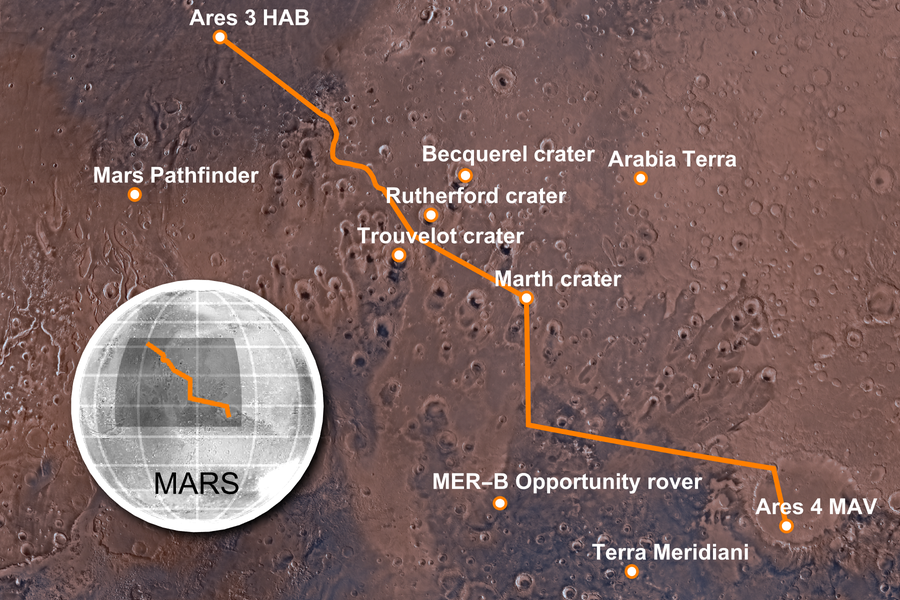
天体图
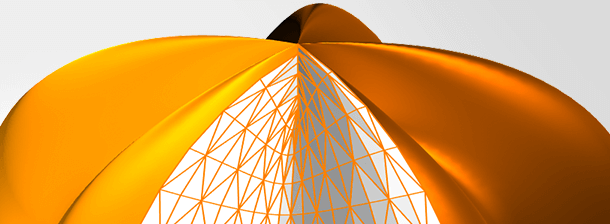
大胆创新,提供前所未有的天体图。使用卫星图像或高程数据来构建大型天体(如月球或太阳系的固体行星)真实可靠的地理图。可将适用于地球地理学的全套工具应用于行星地理学。
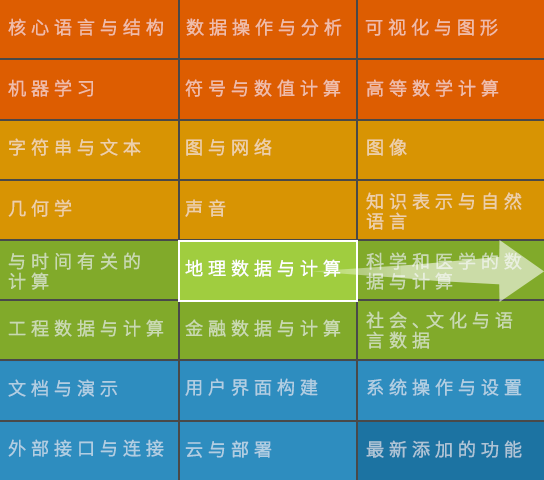
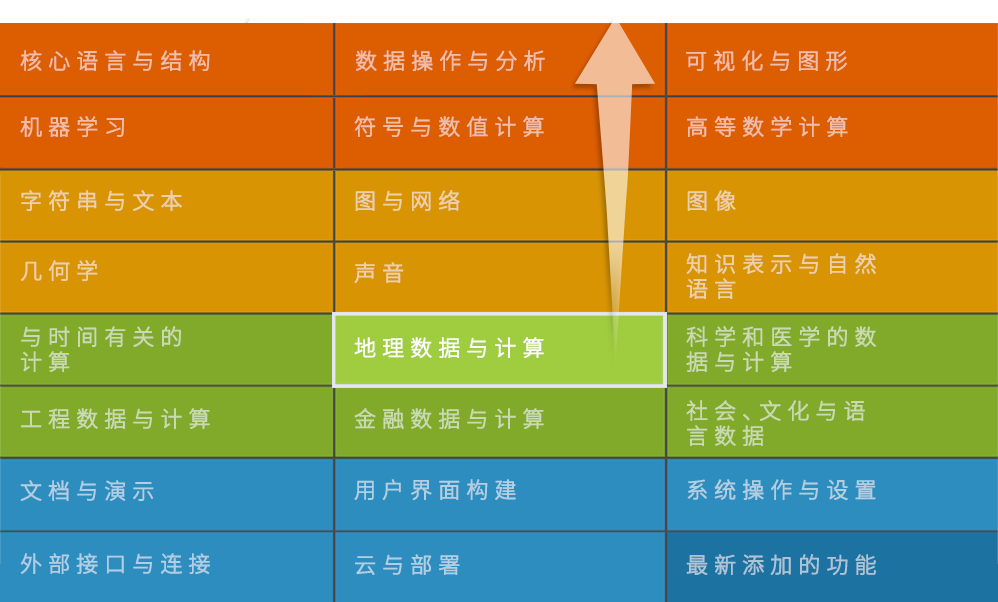
Wolfram 地理学的相关参考资料
Wolfram 地理学是 Wolfram 语言的一个组成部分。整个系统包含了六千多个内置函数,涵盖了计算领域的方方面面,所有内容被精心集成在一起,相互支持,完美地结合为一个整体。
所有资料与参考文档
GeoPosition ▪ GeoDistance ▪ GeoDirection ▪ GeoLength ▪ GeoArea ▪ GeoGraphics ▪ DynamicGeoGraphics ▪ GeoImage ▪ GeoPolygon ▪ GeoPath ▪ GeoMarker ▪ TravelDirections ▪ GeoDestination ▪ GeoDisplacement ▪ GeoDisk ▪ GeoCircle ▪ GeoHemisphere ▪ GeoHemisphereBoundary ▪ GeoVisibleRegion ▪ GeoVisibleRegionBoundary ▪ DayHemisphere ▪ NightHemisphere ▪ DayNightTerminator ▪ GeoBoundary ▪ GeoNearest ▪ GeoEntities ▪ GeoIdentify ▪ GeoWithinQ ▪ Here ▪ FindGeoLocation ▪ $GeoLocation ▪ $GeoLocationCity ▪ $GeoLocationCountry ▪ GeoLocation ▪ GeoAntipode ▪ RandomGeoPosition ▪ GeoPositionXYZ ▪ GeoGridPosition ▪ GeoPositionENU ▪ GeoVector ▪ GeoVectorXYZ ▪ GeoGridVector ▪ GeoVectorENU ▪ GeoListPlot ▪ GeoRegionValuePlot ▪ GeoHistogram ▪ GeoSmoothHistogram ▪ GeoVectorPlot ▪ GeoStreamPlot ▪ GeoGraphPlot ▪ GeoGraphValuePlot ▪ GeoContourPlot ▪ GeoDensityPlot ▪ GeodesyData ▪ GeoElevationData ▪ GeoProjectionData ▪ GeoRange ▪ GeoRangePadding ▪ GeoCenter ▪ GeoProjection ▪ GeoZoomLevel ▪ GeoResolution ▪ GeoGridRange ▪ GeoGridRangePadding ▪ GeoModel ▪ GeoBackground ▪ GeoServer ▪ GeoGridLines ▪ GeoGridLinesStyle ▪ GeoScaleBar ▪ GeoLabels ▪ GeoArraySize ▪ GeoDistanceList ▪ GeoBounds ▪ GeoBoundingBox ▪ GeoGridUnitDistance ▪ GeoGridUnitArea ▪ GeoGridDirectionDifference ▪ TravelDistance ▪ TravelTime ▪ TravelMethod ▪ GeoStyling ▪ GeoStylingFunction ▪ GeoVariant ▪ GeoGroup ▪ GeogravityModelData ▪ GeomagneticModelData ▪ GeologicalPeriodData ▪ CountryData ▪ CityData ▪ AdministrativeDivisionData ▪ Commonest ▪ Median ▪ Total ▪ Length ▪ FinancialData ▪ DateListPlot ▪ EntityProperty ▪ EntityPropertyClass ▪ DateList ▪ Max ▪ Mean ▪ Min ▪ StandardDeviation ▪ EntityGroup ▪ EntityInstance ▪ Triangle ▪ ExampleData ▪ Texture ▪ MomentOfInertia ▪ MinMax ▪ LatitudeLongitude ▪ RegionBounds ▪ CoordinateBounds ▪ Subsequences ▪ TemplateObject ▪ StringTemplate ▪ URLFetch ▪ URLRead ▪ URLSubmit ▪ PlanetaryMoonData ▪ ZoomFactor ▪ ViewProjection ▪ Scaled ▪ Options ▪ ArrayPlot ▪ ListPlot3D ▪ DataRange ▪ ListDensityPlot ▪ ContourLabels ▪ Contours ▪ ContourShading ▪ ContourStyle ▪ InterpolationOrder ▪ MaxPlotPoints ▪ Placed ▪ BarLegend ▪ ListContourPlot ▪ Large ▪ Medium ▪ Small ▪ EdgeValueRange ▪ EdgeValueSizes ▪ MinPointSeparation ▪ UndirectedEdge ▪ TwoWayRule ▪ AnnotationRules ▪ DirectedEdges ▪ Rule ▪ DirectedEdge ▪ EdgeLabelStyle ▪ EdgeShapeFunction ▪ EdgeStyle ▪ GraphHighlight ▪ GraphHighlightStyle ▪ VertexLabelStyle ▪ VertexShape ▪ VertexShapeFunction ▪ VertexSize ▪ VertexStyle ▪ EdgeLabels ▪ VertexLabels ▪ GraphLayout ▪ VertexCoordinates ▪ GraphPlot ▪ Graph ▪ Graph3D ▪ StreamColorFunction ▪ StreamMarkers ▪ StreamScale ▪ StreamStyle ▪ ColorData ▪ StreamColorFunctionScaling ▪ StreamPlot ▪ Norm ▪ StreamPoints ▪ RegionBoundaryStyle ▪ RegionFillingStyle ▪ VectorAspectRatio ▪ VectorColorFunctionScaling ▪ VectorMarkers ▪ VectorPoints ▪ VectorRange ▪ VectorScaling ▪ VectorSizes ▪ VectorColorFunction ▪ VectorStyle ▪ ListStreamPlot ▪ ListVectorDensityPlot ▪ ListStreamDensityPlot ▪ VectorDisplacementPlot ▪ ListVectorPlot ▪ VectorPlot ▪ ListVectorPlot3D ▪ ListStreamPlot3D ▪ SmoothHistogram ▪ Interval ▪ BoxRatios ▪ LightingAngle ▪ MaxRecursion ▪ Mesh ▪ MeshFunctions ▪ MeshShading ▪ MeshStyle ▪ OpacityFunctionScaling ▪ OpacityFunction ▪ PlotPoints ▪ WorkingPrecision ▪ MachinePrecision ▪ BoundaryStyle ▪ RegionFunction ▪ SmoothHistogram3D ▪ SmoothDensityHistogram ▪ SmoothKernelDistribution ▪ LabelingFunction ▪ PerformanceGoal ▪ $PerformanceGoal ▪ PlotTheme ▪ $PlotTheme ▪ Association ▪ Directive ▪ DensityHistogram ▪ ClippingStyle ▪ ColorFunctionBinning ▪ ColorFunctionScaling ▪ ColorFunction ▪ ColorRules ▪ LabelingSize ▪ MissingStyle ▪ ScalingFunctions ▪ TargetUnits ▪ Tiny ▪ WeightedData ▪ Annotation ▪ Button ▪ EventHandler ▪ Hyperlink ▪ Labeled ▪ Legended ▪ StatusArea ▪ Joined ▪ PlotLegends ▪ PlotMarkers ▪ PlotStyle ▪ TemporalData ▪ TimeSeries ▪ EventSeries ▪ WolframAlpha ▪ ListPlot ▪ Gudermannian ▪ GraphicsComplex ▪ RandomPoint ▪ SeedRandom ▪ BlockRandom ▪ RandomVariate ▪ Block ▪ $GeoLocationSource ▪ $RequesterAddress ▪ AllowedCloudExtraParameters ▪ $MachineAddresses ▪ $MachineDomains ▪ IPAddress ▪ Outer ▪ MemberQ ▪ RegionMember ▪ Except ▪ TimeConstraint ▪ Nearest ▪ Element ▪ $TimeZone ▪ Now ▪ SunPosition ▪ SatelliteData ▪ BuildingData ▪ MountainData ▪ FilledCurve ▪ FaceForm ▪ AngleVector ▪ Dataset ▪ TravelDirectionsData ▪ Alignment ▪ Left ▪ Right ▪ Top ▪ Bottom ▪ Inset ▪ ImageMarker ▪ AbsoluteThickness ▪ Thick ▪ Thin ▪ AbsoluteDashing ▪ Dashed ▪ Dotted ▪ CMYKColor ▪ GrayLevel ▪ Hue ▪ VertexColors ▪ JoinForm ▪ CapForm ▪ AnglePath ▪ DynamicImage ▪ AbsoluteOptions ▪ StandardForm ▪ AlignmentPoint ▪ Center ▪ AspectRatio ▪ Axes ▪ AxesLabel ▪ AxesOrigin ▪ AxesStyle ▪ Background ▪ BaselinePosition ▪ BaseStyle ▪ ContentSelectable ▪ CoordinatesToolOptions ▪ Epilog ▪ FormatType ▪ TraditionalForm ▪ Frame ▪ FrameLabel ▪ FrameStyle ▪ FrameTicks ▪ FrameTicksStyle ▪ GridLines ▪ GridLinesStyle ▪ ImageMargins ▪ ImagePadding ▪ ImageSize ▪ LabelStyle ▪ MetaInformation ▪ Method ▪ PlotLabel ▪ All ▪ PlotRangeClipping ▪ False ▪ PlotRegion ▪ PreserveImageOptions ▪ Prolog ▪ RasterSize ▪ RotateLabel ▪ True ▪ Ticks ▪ TicksStyle ▪ PlotRange ▪ PlotRangePadding ▪ Full ▪ ReliefPlot ▪ Missing ▪ Area ▪ JoinedCurve ▪ Automatic ▪ ArcLength ▪ UnitSystem ▪ DistanceFunction ▪ QuantityArray ▪ Dated ▪ $UnitSystem ▪ Partition ▪ DistanceMatrix ▪ CentralFeature ▪ SpatialMedian ▪ DateObject ▪ Integer ▪ None ▪ DateValue ▪ Real ▪ EntityValue ▪ Graphics ▪ Degree ▪ Latitude ▪ Longitude ▪ SemanticInterpretation ▪ CommonName ▪ EntityClass ▪ EntityList ▪ WikipediaSearch ▪ LocalTimeZone ▪ GeoOrientationData ▪ WikipediaData ▪ WeatherForecastData ▪ EarthquakeData ▪ PlanetData ▪ Interpreter ▪ PointValuePlot ▪ GeoBubbleChart ▪ Quantity ▪ DMSString ▪ DMSList ▪ FromDMS ▪ Point ▪ Line ▪ Arrow ▪ Polygon ▪ Disk ▪ Circle ▪ Style ▪ Red ▪ RGBColor ▪ Opacity ▪ EdgeForm ▪ Thickness ▪ Dashing ▪ GeoBoundsRegion ▪ GeoBoundsRegionBoundary ▪ Text ▪ Tooltip ▪ PopupWindow ▪ Mouseover ▪ Image ▪ GeoStylingImageFunction ▪ Entity ▪ WeatherData ▪ AirTemperatureData ▪ LocalTime ▪ Sunrise ▪ TravelDistanceList ▪ Import ▪