Analyzing Biking Data
Data accessed directly from sources such as RunKeeper or downloaded from a multitude of fitness apps can be easily processed and analyzed.
Here is a time series representation of an example bicycle ride and a visualization of the bike route on a map.
| In[1]:= | X |
| In[2]:= | X |
| Out[2]= | 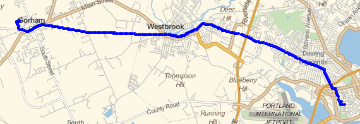 |
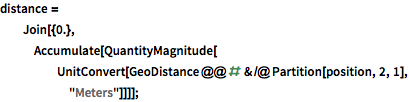
Compute total distance, ride duration, and average speed.
| In[3]:= | X |
| Out[3]= |
| In[4]:= | 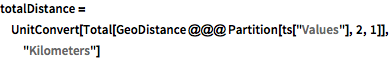 X |
| Out[4]= |
| In[5]:= | X |
| Out[5]= |
More interestingly, compute and show uphill and downhill segments of the route as well as global statistics such as total times, distances, and average speeds on ascending and descending portions of the road.
Extract time, position (latitude, longitude), and elevation data from the time series.
| In[6]:= | 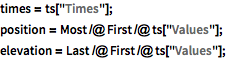 X |
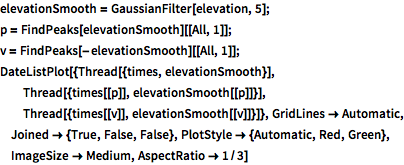
Smooth data; find and show peaks (red) and valleys (green).
| Out[7]= | 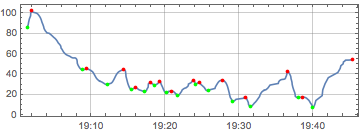 |
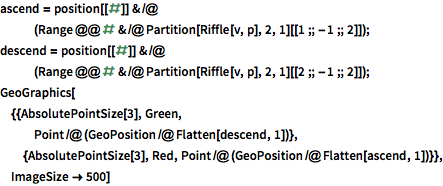
Compute and visualize the ascending (red) and descending (green) segments of the bike ride.
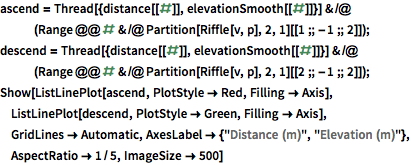
| Out[9]= | 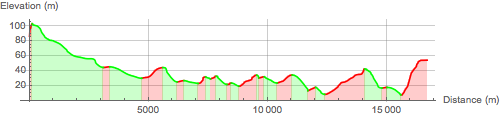 |
Total times of uphill and downhill segments.
| In[10]:= | 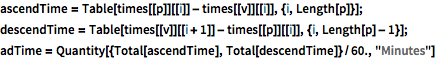 X |
| Out[10]= |
Total distances of uphill and downhill segments.
| In[11]:= | 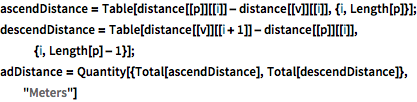 X |
| Out[11]= |
Average speeds in uphill and downhill segments.
| In[12]:= | X |
| Out[12]= |
Visualize the uphill (red) and downhill (green) segments of the ride on a map of the bike route.
| Out[13]= | 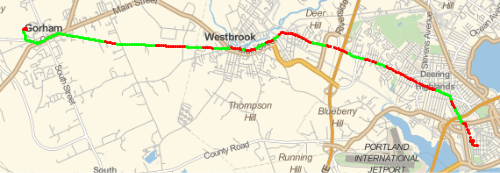 |