Plot Time and Event Series
Plot the population growth of the United States from 1970 to 2013.
| In[1]:= | X |
| In[2]:= | X |
| In[3]:= | X |
| In[4]:= | X |
| Out[4]= | 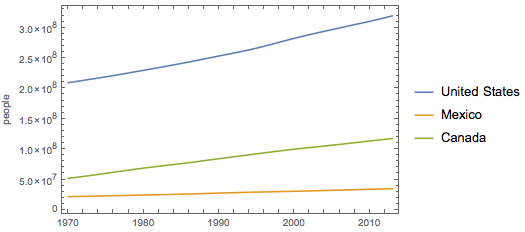 |
Plot the population growth of the United States from 1970 to 2013.
| In[1]:= | X |
| In[2]:= | X |
| In[3]:= | X |
| In[4]:= | X |
| Out[4]= | |
 New Default Styles »
 Improved Styles for Color Vision Impairment »
 Use Plot Themes to Customize Plots »
 Adaptive Point Size Selection »
 Plot Functions Using Units »
 Units Improvement »
 Units for Legends »
 Use Weighted Data Instead of a Full Dataset »
 Plot Time and Event Series »
 Plot Keys and Values from Associations »
 Plot Values from Associations »
 Use Combinations of Wrappers »
Questions? Comments? Contact a Wolfram expert »