Graphics & Visualization
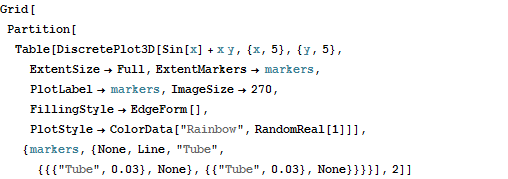
Control 3D Extent Region Boundaries
Specify elements used to mark the left, right, front, and back edges of the extent regions.
| In[1]:= |  X |
| Out[1]= |  |
| New in Wolfram Mathematica 8: New and Improved Scientific and Information Visualization | ◄ previous | next ► |
| In[1]:= |  X |
| Out[1]= |  |