New in Wolfram
Mathematica
8: New and Improved Scientific and Information Visualization
◄
previous
|
next
►
Graphics & Visualization
Control Extent Region Boundaries
Specify elements used to mark the left and right edges of the extent regions.
In[1]:=
X
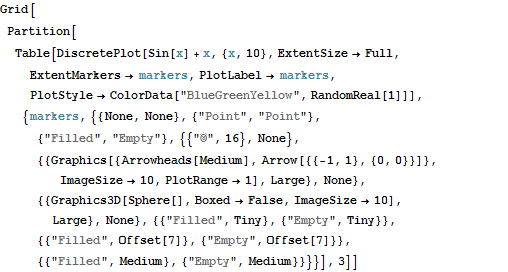
Grid[Partition[ Table[DiscretePlot[Sin[x] + x, {x, 10}, ExtentSize -> Full, ExtentMarkers -> markers, PlotLabel -> markers, PlotStyle -> ColorData["BlueGreenYellow", RandomReal[1]]], {markers, {{None, None}, {"Point", "Point"}, {"Filled", "Empty"}, {{"\[FreakedSmiley]", 16}, None}, {{Graphics[{Arrowheads[Medium], Arrow[{{-1, 1}, {0, 0}}]}, ImageSize -> 10, PlotRange -> 1], Large}, None}, {{Graphics3D[Sphere[], Boxed -> False, ImageSize -> 10], Large}, None}, {{"Filled", Tiny}, {"Empty", Tiny}}, {{"Filled", Offset[7]}, {"Empty", Offset[7]}}, {{"Filled", Medium}, {"Empty", Medium}}}}], 3]]
Out[1]=