New in Wolfram
Mathematica
8: Parameter Estimation and Testing
◄
previous
|
next
►
Core Algorithms
Compare Distribution Functions for Estimated and Theoretical Copulas
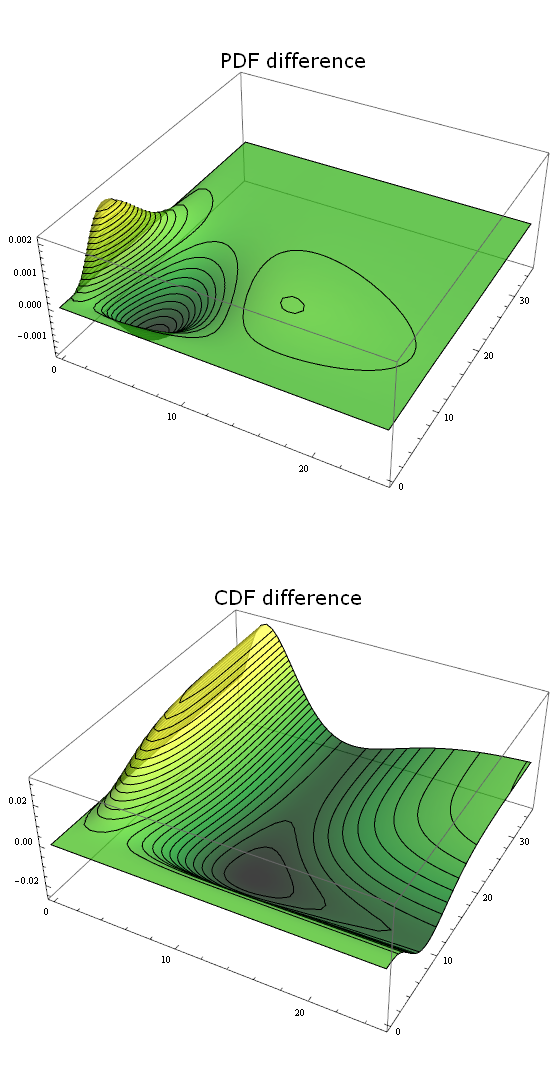
Compare differences in the PDF and CDF for an estimated copula and the PDF and CDF for the distribution the data was sampled from.
In[1]:=
X
\[ScriptCapitalD]o = CopulaDistribution[{"Frank", 1/2}, {GammaDistribution[2, 3], ChiSquareDistribution[10]}]; data = BlockRandom[SeedRandom[987]; RandomVariate[\[ScriptCapitalD]o, 100]];
In[2]:=
X
\[ScriptCapitalD]e = EstimatedDistribution[data, CopulaDistribution[{"Frank", c}, {GammaDistribution[\[Alpha], \[Beta]], ChiSquareDistribution[n]}]];
In[3]:=
X
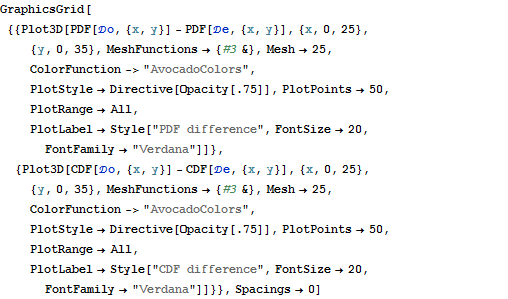
GraphicsGrid[{{Plot3D[ PDF[\[ScriptCapitalD]o, {x, y}] - PDF[\[ScriptCapitalD]e, {x, y}], {x, 0, 25}, {y, 0, 35}, MeshFunctions -> {#3 &}, Mesh -> 25, ColorFunction -> "AvocadoColors", PlotStyle -> Directive[Opacity[.75]], PlotPoints -> 50, PlotRange -> All, PlotLabel -> Style["PDF difference", FontSize -> 20, FontFamily -> "Verdana"]]}, {Plot3D[ CDF[\[ScriptCapitalD]o, {x, y}] - CDF[\[ScriptCapitalD]e, {x, y}], {x, 0, 25}, {y, 0, 35}, MeshFunctions -> {#3 &}, Mesh -> 25, ColorFunction -> "AvocadoColors", PlotStyle -> Directive[Opacity[.75]], PlotPoints -> 50, PlotRange -> All, PlotLabel -> Style["CDF difference", FontSize -> 20, FontFamily -> "Verdana"]]}}, Spacings -> 0]
Out[3]=