New in Wolfram
Mathematica
8: Parameter Estimation and Testing
◄
previous
|
next
►
Core Algorithms
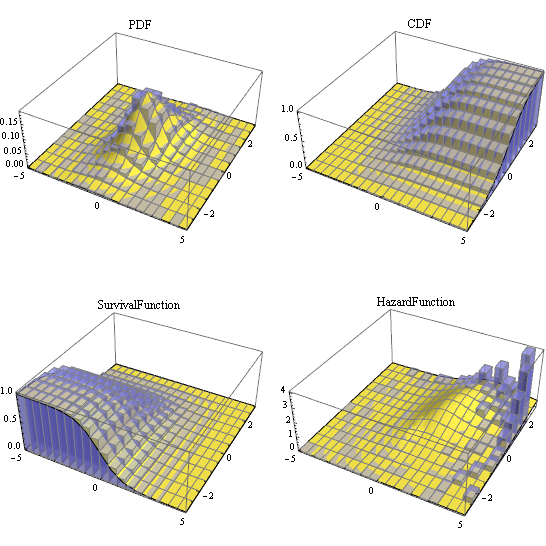
Visualize Distribution Functions for a Fitted Multivariate Distribution
Compare the PDF, CDF, survival, and hazard functions for a fitted multivariate
distribution to histograms for the data.
In[1]:=
X
CompareHistogram3D[dist_, {xmin_, xmax_, dx_}, {ymin_, ymax_, dy_}, df_: PDF, opts___?OptionQ] := Module[{hist, dplot}, hist = Histogram3D[ RandomVariate[dist, 10^4], {{xmin, xmax, dx}, {ymin, ymax, dy}}, ToString[df] /. {"SurvivalFunction" -> "SF", "HazardFunction" -> "HF"}, PlotRange -> {{xmin, xmax}, {ymin, ymax}, All}, ChartBaseStyle -> Opacity[0.5]]; dplot = Plot3D[df[dist, {x, y}], {x, xmin, xmax}, {y, ymin, ymax}, Mesh -> {Range[xmin, xmax, dx], Range[ymin, ymax, dy]}, PlotRange -> All, MeshStyle -> Gray, PlotStyle -> Hue[.15, .7, .8]]; Show[hist, dplot, opts] ];
In[2]:=
X
\[ScriptCapitalD] = MultivariateTDistribution[{{1, 1/3}, {1/3, 1}}, 7]; data = BlockRandom[SeedRandom[1234]; RandomVariate[\[ScriptCapitalD], 1000]];
In[3]:=
X
edist = EstimatedDistribution[data, MultivariateTDistribution[{{a, b}, {b, c}}, n]];
In[4]:=
X
GraphicsGrid[ Partition[ Table[CompareHistogram3D[edist, {-5, 5, .5}, {-3, 3, .5}, i, PlotLabel -> i], {i, {PDF, CDF, SurvivalFunction, HazardFunction}}], 2]]
Out[4]=