New in Wolfram
Mathematica
8: Parameter Estimation and Testing
◄
previous
|
next
►
Core Algorithms
Compare Two Models of Wind Speeds
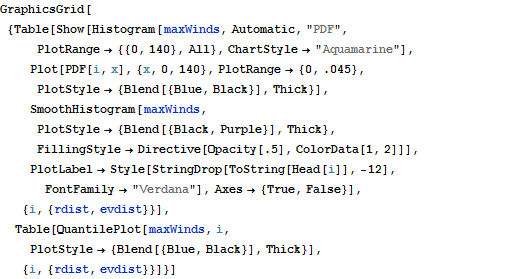
Fit wind speed data to Rayleigh and extreme value models, visually compare fits and data with kernel density estimates, and qualitatively compare the empirical and fitted quantiles.
In[1]:=
X
maxWinds = WeatherData["Boston", "MaxWindSpeed", {{1950, 1, 1}, {2009, 12, 31}, "Month"}][[ All, -1]];
In[2]:=
X
rdist = EstimatedDistribution[maxWinds, RayleighDistribution[\[Theta]]]; evdist = EstimatedDistribution[maxWinds, ExtremeValueDistribution[a, b]];
In[3]:=
X
GraphicsGrid[{Table[ Show[Histogram[maxWinds, Automatic, "PDF", PlotRange -> {{0, 140}, All}, ChartStyle -> "Aquamarine"], Plot[PDF[i, x], {x, 0, 140}, PlotRange -> {0, .045}, PlotStyle -> {Blend[{Blue, Black}], Thick}], SmoothHistogram[maxWinds, PlotStyle -> {Blend[{Black, Purple}], Thick}, FillingStyle -> Directive[Opacity[.5], ColorData[1, 2]]], PlotLabel -> Style[StringDrop[ToString[Head[i]], -12], FontFamily -> "Verdana"], Axes -> {True, False}], {i, {rdist, evdist}}], Table[QuantilePlot[maxWinds, i, PlotStyle -> {Blend[{Blue, Black}], Thick}], {i, {rdist, evdist}}]}]
Out[3]=