Core Algorithms
Decompose Mixture Models of Earthquake Magnitudes
Plot components of a mixture model for historical earthquake magnitudes against the data and visualize the probability that particular magnitudes come from each component of the model.
| In[1]:= | 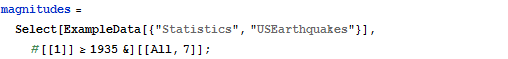 X |
| In[2]:= | 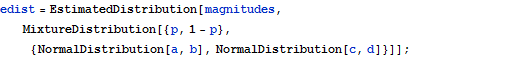 X |
| In[3]:= | 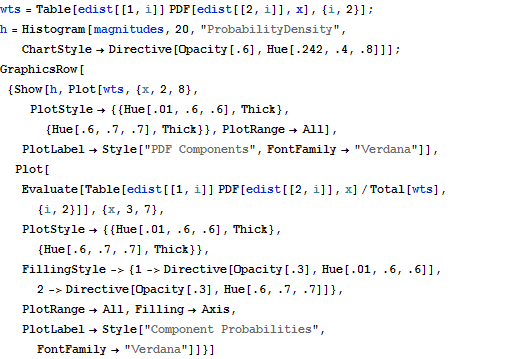 X |
| Out[3]= | 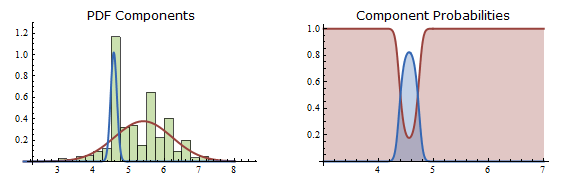 |