New in Wolfram
Mathematica
8: Parametric Probability Distributions
◄
previous
|
next
►
Core Algorithms
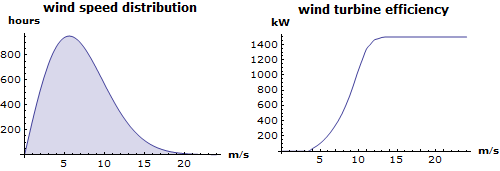
Analyze Energy Production from a Wind Turbine
Model wind speeds using a
WeibullDistribution
and use a measured efficiency curve for a GE 1.5MW wind turbine to find the expected energy production over a year.
In[1]:=
X
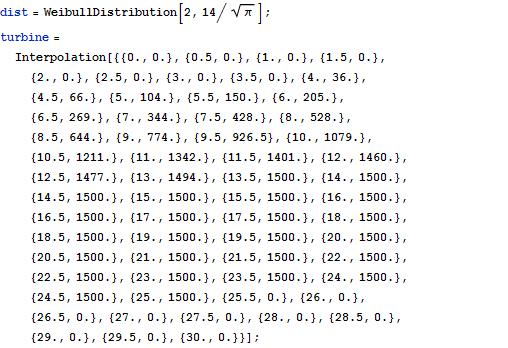
dist = WeibullDistribution[2, 14/Sqrt[\[Pi]]]; turbine = Interpolation[{{0., 0.}, {0.5, 0.}, {1., 0.}, {1.5, 0.}, {2., 0.}, {2.5, 0.}, {3., 0.}, {3.5, 0.}, {4., 36.}, {4.5, 66.}, {5., 104.}, {5.5, 150.}, {6., 205.}, {6.5, 269.}, {7., 344.}, {7.5, 428.}, {8., 528.}, {8.5, 644.}, {9., 774.}, {9.5, 926.5}, {10., 1079.}, {10.5, 1211.}, {11., 1342.}, {11.5, 1401.}, {12., 1460.}, {12.5, 1477.}, {13., 1494.}, {13.5, 1500.}, {14., 1500.}, {14.5, 1500.}, {15., 1500.}, {15.5, 1500.}, {16., 1500.}, {16.5, 1500.}, {17., 1500.}, {17.5, 1500.}, {18., 1500.}, {18.5, 1500.}, {19., 1500.}, {19.5, 1500.}, {20., 1500.}, {20.5, 1500.}, {21., 1500.}, {21.5, 1500.}, {22., 1500.}, {22.5, 1500.}, {23., 1500.}, {23.5, 1500.}, {24., 1500.}, {24.5, 1500.}, {25., 1500.}, {25.5, 0.}, {26., 0.}, {26.5, 0.}, {27., 0.}, {27.5, 0.}, {28., 0.}, {28.5, 0.}, {29., 0.}, {29.5, 0.}, {30., 0.}}];
In[2]:=
X
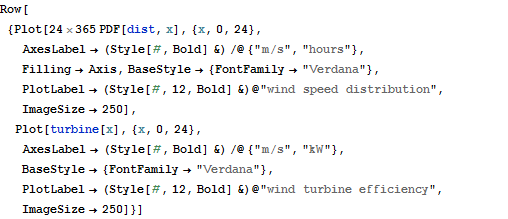
Row[{Plot[24 365 PDF[dist, x], {x, 0, 24}, AxesLabel -> (Style[#, Bold] &) /@ {"m/s", "hours"}, Filling -> Axis, BaseStyle -> {FontFamily -> "Verdana"}, PlotLabel -> (Style[#, 12, Bold] &)@"wind speed distribution", ImageSize -> 250], Plot[turbine[x], {x, 0, 24}, AxesLabel -> (Style[#, Bold] &) /@ {"m/s", "kW"}, BaseStyle -> {FontFamily -> "Verdana"}, PlotLabel -> (Style[#, 12, Bold] &)@"wind turbine efficiency", ImageSize -> 250]}]
Out[2]=
In[3]:=
X
NExpectation[24 365 turbine[x], x \[Distributed] dist]
Out[3]=