Wolfram
Mathematica
8의 신기능: 통계의 시각화
◄
이전
|
다음
►
그래픽 및 시각화
Bin 분할 및 Smooth 히스토그램
빈 분할 또는 커널 smooth 기법을 사용하여 분포의 형상을 시각화 합니다.
In[1]:=
X
data1 = RandomVariate[NormalDistribution[0, 1], 10^3]; data2 = RandomVariate[BinormalDistribution[1/2], 10^3];
In[2]:=
X
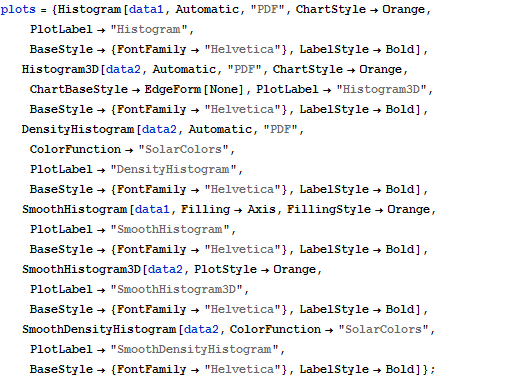
plots = {Histogram[data1, Automatic, "PDF", ChartStyle -> Orange, PlotLabel -> "Histogram", BaseStyle -> {FontFamily -> "Helvetica"}, LabelStyle -> Bold], Histogram3D[data2, Automatic, "PDF", ChartStyle -> Orange, ChartBaseStyle -> EdgeForm[None], PlotLabel -> "Histogram3D", BaseStyle -> {FontFamily -> "Helvetica"}, LabelStyle -> Bold], DensityHistogram[data2, Automatic, "PDF", ColorFunction -> "SolarColors", PlotLabel -> "DensityHistogram", BaseStyle -> {FontFamily -> "Helvetica"}, LabelStyle -> Bold], SmoothHistogram[data1, Filling -> Axis, FillingStyle -> Orange, PlotLabel -> "SmoothHistogram", BaseStyle -> {FontFamily -> "Helvetica"}, LabelStyle -> Bold], SmoothHistogram3D[data2, PlotStyle -> Orange, PlotLabel -> "SmoothHistogram3D", BaseStyle -> {FontFamily -> "Helvetica"}, LabelStyle -> Bold], SmoothDensityHistogram[data2, ColorFunction -> "SolarColors", PlotLabel -> "SmoothDensityHistogram", BaseStyle -> {FontFamily -> "Helvetica"}, LabelStyle -> Bold]};
In[3]:=
X
Grid[Partition[plots, 3]]
Out[3]=