Graphics & Visualization
Statistical Visualization
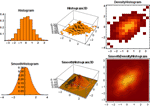
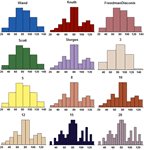
Mathematica 8 brings a high level of algorithm automation and computational aesthetics to statistical visualization. Histograms—binned or smoothed—show the shapes of distributions. Quantile and probability plots compare data to a reference distribution. Box-and-whisker and distribution charts compare the distribution shapes for several datasets.
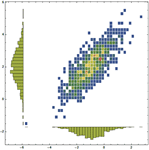
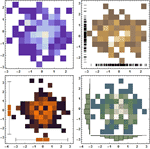
- New pairwise histogram and density histogram functions. »
- Additional automatic binning methods.
- Direct support for several distribution functions (PDF, CDF, survival function, hazard function, cumulative hazard function) for all histogram functions. »
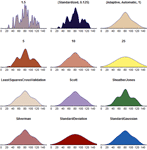
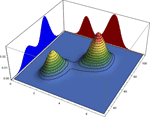
- New suite of smooth kernel density estimate-based visualization functions for univariate and bivariate distributions. »
- Fully automatic adaptive bandwidth selection or advanced user control for ideal tradeoff between smoothing and noise in density estimates.
- Direct support for several distributions (PDF, CDF, survival function, hazard function, cumulative hazard function) for all smooth kernel density estimates. »
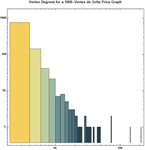
- Support for logarithmic scaling of binned or kernel density-based histograms.
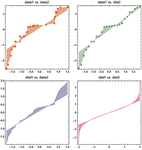
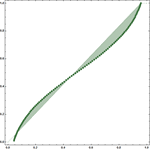
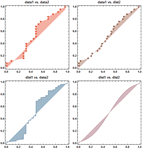
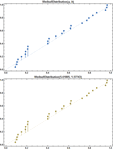
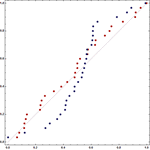
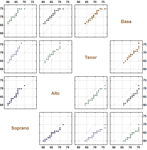
- New quantile-quantile and probability-probability plot functions. »
- Automatic support for data vs. data, data vs. distribution, and distribution vs. distribution in quantile-quantile and probability-probability plot functions.
- Automatic parameter estimation in quantile-quantile and probability-probability plots when comparing to a distribution family.
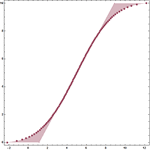
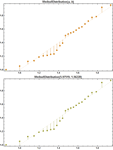
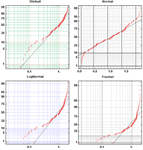
- New probability-scale plot supporting Weibull, normal, exponential, Gumbel, etc. plots. »
- Automatic support for probability scales and probability-paper in probability scale plots.
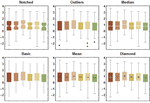
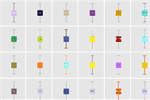
- New fully customizable box-and-whisker chart function. »
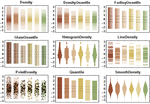
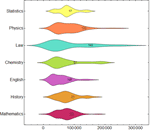
- New distribution chart functionality showing complete distribution shape estimates. »
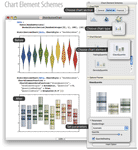
- Full suite of chart element functions for a wide variety of aesthetics for box-and-whisker and distribution charting functions.
