New in Wolfram
Mathematica
8: Statistical Visualization
◄
previous
|
next
►
Graphics & Visualization
Visualize Marginal Distributions for Estimated Distributions
Combine a smooth histogram of Old Faithful eruption durations and intervals with smooth histograms for the specific components.
In[1]:=
X
data = ExampleData[{"Statistics", "OldFaithful"}];
In[2]:=
X
back = ImageData[ Rasterize[ SmoothHistogram[data[[All, 1]], Axes -> None, PlotRange -> {{0, 7}, All}, PlotStyle -> Red, Filling -> {1 -> {Axis, Red}}, PlotRangePadding -> Scaled[0.02]], Background -> None]];
In[3]:=
X
left = ImageData[ Rasterize[ SmoothHistogram[data[[All, 2]], Axes -> None, PlotRange -> {{30, 110}, {0, All}}, Filling -> {1 -> {Axis, Blue}}, PlotRangePadding -> Scaled[0.02]], Background -> None]];
In[4]:=
X
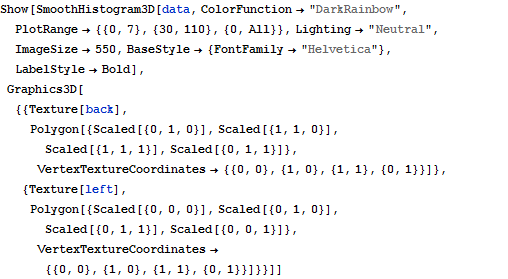
Show[SmoothHistogram3D[data, ColorFunction -> "DarkRainbow", PlotRange -> {{0, 7}, {30, 110}, {0, All}}, Lighting -> "Neutral", ImageSize -> 550, BaseStyle -> {FontFamily -> "Helvetica"}, LabelStyle -> Bold], Graphics3D[{{Texture[back], Polygon[{Scaled[{0, 1, 0}], Scaled[{1, 1, 0}], Scaled[{1, 1, 1}], Scaled[{0, 1, 1}]}, VertexTextureCoordinates -> {{0, 0}, {1, 0}, {1, 1}, {0, 1}}]}, {Texture[left], Polygon[{Scaled[{0, 0, 0}], Scaled[{0, 1, 0}], Scaled[{0, 1, 1}], Scaled[{0, 0, 1}]}, VertexTextureCoordinates -> {{0, 0}, {1, 0}, {1, 1}, {0, 1}}]}}]]
Out[4]=