Wolfram
Mathematica
8의 신기능: 통계의 시각화
◄
이전
|
다음
►
그래픽 및 시각화
히스토그램과 데이터의 조합
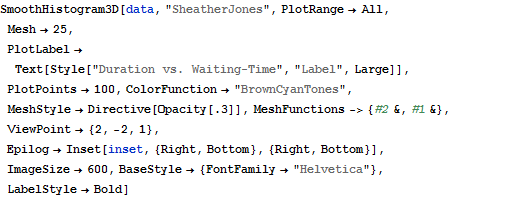
실제 데이터를 나타내는 산점도 그래프를 3D smooth 히스토그램과 함께 나타낼 수 있습니다.
In[1]:=
X
data = ExampleData[{"Statistics", "OldFaithful"}];
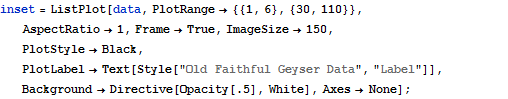
In[2]:=
X
inset = ListPlot[data, PlotRange -> {{1, 6}, {30, 110}}, AspectRatio -> 1, Frame -> True, ImageSize -> 150, PlotStyle -> Black, PlotLabel -> Text[Style["Old Faithful Geyser Data", "Label"]], Background -> Directive[Opacity[.5], White], Axes -> None];
In[3]:=
X
SmoothHistogram3D[data, "SheatherJones", PlotRange -> All, Mesh -> 25, PlotLabel -> Text[Style["Duration vs. Waiting\[Hyphen]Time", "Label", Large]], PlotPoints -> 100, ColorFunction -> "BrownCyanTones", MeshStyle -> Directive[Opacity[.3]], MeshFunctions -> {#2 &, #1 &}, ViewPoint -> {2, -2, 1}, Epilog -> Inset[inset, {Right, Bottom}, {Right, Bottom}], ImageSize -> 600, BaseStyle -> {FontFamily -> "Helvetica"}, LabelStyle -> Bold]
Out[3]=