Wolfram
Mathematica
8의 신기능: 통계의 시각화
◄
이전
|
다음
►
그래픽 및 시각화
로그 범위 히스토그램
PriceGraphDistribution
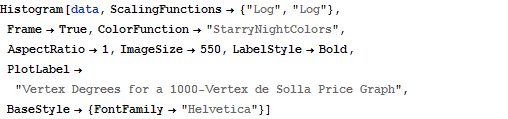
의 꼭지점 차수 분포는 두꺼운 꼬리 분포입니다. 좌표에 대한 로그 범위를 이용하여 읽기 쉬운 히스토그램을 만들 수 있습니다.
In[1]:=
X
g = RandomGraph[PriceGraphDistribution[10^3, 2, 1]];
In[2]:=
X
data = VertexDegree[g];
In[3]:=
X
Histogram[data, ScalingFunctions -> {"Log", "Log"}, Frame -> True, ColorFunction -> "StarryNightColors", AspectRatio -> 1, ImageSize -> 550, LabelStyle -> Bold, PlotLabel -> "Vertex Degrees for a 1000-Vertex de Solla Price Graph", BaseStyle -> {FontFamily -> "Helvetica"}]
Out[3]=