New in Wolfram
Mathematica
8: Wavelet Analysis
◄
previous
|
next
►
Application Areas
Threshold Multidimensional Data
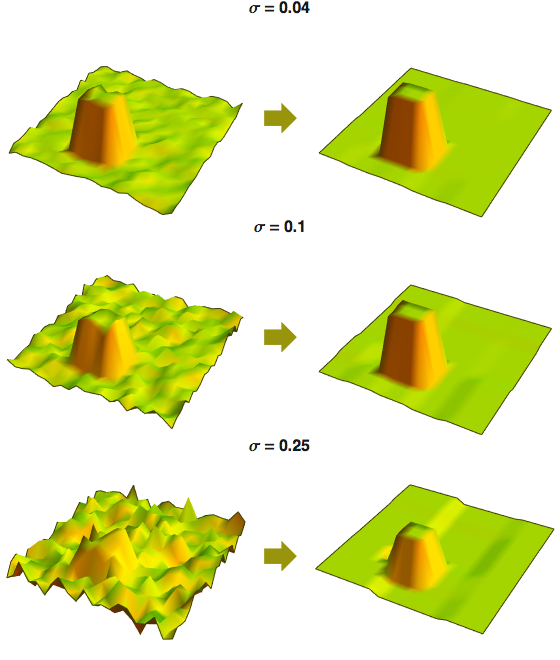
Denoise two-dimensional data.
In[1]:=
X
data = Table[ UnitStep[i - 4, 7 - i] UnitStep[j - 7, 11 - j], {i, 0, 20}, {j, 0, 20}];
In[2]:=
X
SeedRandom[11]; noisy[\[Sigma]_] := data + RandomReal[NormalDistribution[0, \[Sigma]], Dimensions[data]]
In[3]:=
X
smooth = Composition[InverseWaveletTransform, WaveletThreshold, DiscreteWaveletTransform];
In[4]:=
X
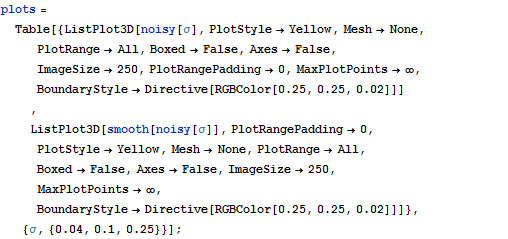
plots = Table[{ListPlot3D[noisy[\[Sigma]], PlotStyle -> Yellow, Mesh -> None, PlotRange -> All, Boxed -> False, Axes -> False, ImageSize -> 250, PlotRangePadding -> 0, MaxPlotPoints -> \[Infinity], BoundaryStyle -> Directive[RGBColor[0.25, 0.25, 0.02]]] , ListPlot3D[smooth[noisy[\[Sigma]]], PlotRangePadding -> 0, PlotStyle -> Yellow, Mesh -> None, PlotRange -> All, Boxed -> False, Axes -> False, ImageSize -> 250, MaxPlotPoints -> \[Infinity], BoundaryStyle -> Directive[RGBColor[0.25, 0.25, 0.02]]]}, {\[Sigma], {0.04, 0.1, 0.25}}];
In[5]:=
X
Show2DThresholdPlot[name_, info_] := Column[{Style[name, 16, Bold, Opacity[0.9], FontFamily -> "Helvetica"], Row[{info[[1]], \!\(\* GraphicsBox[ {Thickness[0.05263157894736842], FaceForm[{RGBColor[ 0.597284, 0.585138, 0.0490272], Opacity[1.]}], FilledCurveBox[{{{0, 2, 0}, {0, 1, 0}, {0, 1, 0}, {0, 1, 0}, {0, 1, 0}, {0, 1, 0}}}, {{{9.9999, 18.}, {9.9999, 13.5}, {-0.00009999999999976694, 13.5}, {-0.00009999999999976694, 4.5}, {9.9999, 4.5}, { 9.9999, 0.}, {18.9999, 9.}}}]}, AspectRatio->Automatic, ImageSize->{60., 31.}, PlotRange->{{0., 19.}, {0., 18.}}]\), info[[2]]}]}, Alignment -> Center, Spacings -> {0, 0}]
In[6]:=
X
Column[MapThread[ Show2DThresholdPlot, {Table[ "\[Sigma] = " <> ToString[\[Sigma]], {\[Sigma], {0.04, 0.1, 0.25}}], plots}], Spacings -> {0, 0}]
Out[6]=