New in Wolfram
Mathematica
8: Wavelet Analysis
◄
previous
|
next
►
Application Areas
Use Different Wavelet Thresholding Methods
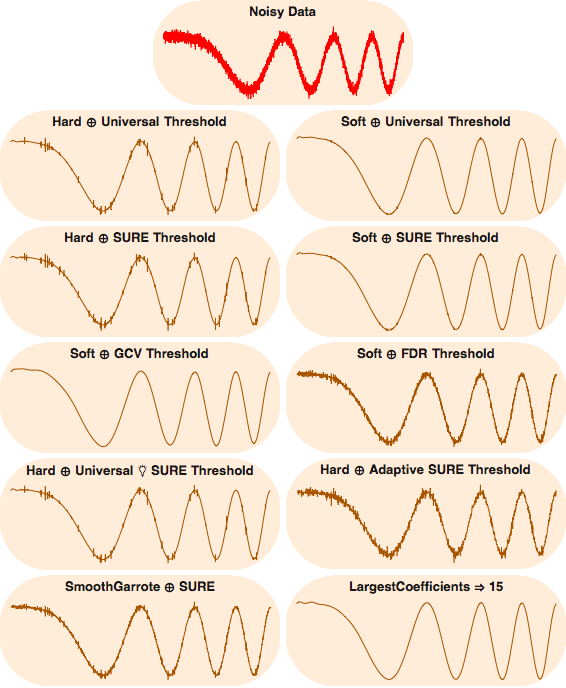
Perform wavelet thresholding using various methods.
In[1]:=
X
data = Table[ 10 Cos[x^2] + RandomReal[NormalDistribution[]], {x, 0, 5, 0.001}];
In[2]:=
X
dwd = StationaryWaveletTransform[data, SymletWavelet[6], 10];
In[3]:=
X
wthresh[th_] := InverseWaveletTransform[WaveletThreshold[dwd, th]]
In[4]:=
X
ShowThresholdPlot[name_, info_] := Framed[Column[{Style[name, 13, Bold, Opacity[0.9], FontFamily -> "Helvetica"], info}, Alignment -> Center], RoundingRadius -> 50, FrameStyle -> None, Background -> Lighter[Orange, 0.85]]
In[5]:=
X
thPlots = Table[ListLinePlot[wthresh[m], PlotStyle -> Darker@Orange, Axes -> None, ImageSize -> 270, AspectRatio -> 0.3], {m, {"Universal", "VisuShrink", "SURE", "SUREShrink", "GCV", "FDR", "SUREHybrid", "SURELevel", {"SmoothGarrote", "SURE", 2}, {"LargestCoefficients", 15}}}];
In[6]:=
X
methods = {"Hard \[CirclePlus] Universal Threshold", "Soft \[CirclePlus] Universal Threshold", "Hard \[CirclePlus] SURE Threshold", "Soft \[CirclePlus] SURE Threshold", "Soft \[CirclePlus] GCV Threshold", "Soft \[CirclePlus] FDR Threshold", "Hard \[CirclePlus] Universal \[LightBulb] SURE Threshold", "Hard \[CirclePlus] Adaptive SURE Threshold", "SmoothGarrote \[CirclePlus] SURE", "LargestCoefficients \[DoubleRightArrow] 15"};
In[7]:=
X
Grid[Join[{{ShowThresholdPlot["Noisy Data", ListLinePlot[{data}, Axes -> False, PlotStyle -> {Orange, Red}, ImageSize -> 250, AspectRatio -> 0.3]], SpanFromLeft}}, Partition[MapThread[ShowThresholdPlot, {methods, thPlots}], 2]], Spacings -> {0.5, 0.5}]
Out[7]=