New in Wolfram
Mathematica
8: Wavelet Analysis
◄
previous
|
next
►
Application Areas
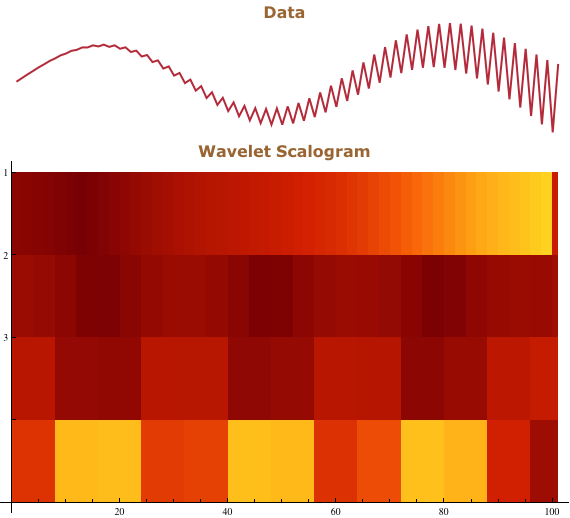
Visualize Discrete Wavelet Transform Using a Scalogram
Perform a discrete wavelet transform and visualize the results using a scalogram.
In[1]:=
X
data = Table[n^2 (-1)^(100 n) + Sin[10 n], {n, 0, 1, 0.01}];
In[2]:=
X
dwd = DiscreteWaveletTransform[data, Automatic, 3, Padding -> 0];
In[3]:=
X
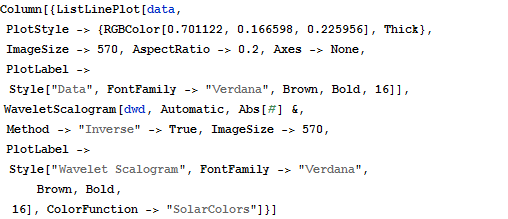
Column[{ListLinePlot[data, PlotStyle -> {RGBColor[0.701122, 0.166598, 0.225956], Thick}, ImageSize -> 570, AspectRatio -> 0.2, Axes -> None, PlotLabel -> Style["Data", FontFamily -> "Verdana", Brown, Bold, 16]], WaveletScalogram[dwd, Automatic, Abs[#] &, Method -> "Inverse" -> True, ImageSize -> 570, PlotLabel -> Style["Wavelet Scalogram", FontFamily -> "Verdana", Brown, Bold, 16], ColorFunction -> "SolarColors"]}]
Out[3]=