New in Wolfram
Mathematica
8: Wavelet Analysis
◄
previous
|
next
►
Application Areas
Wavelet Matrix Plot
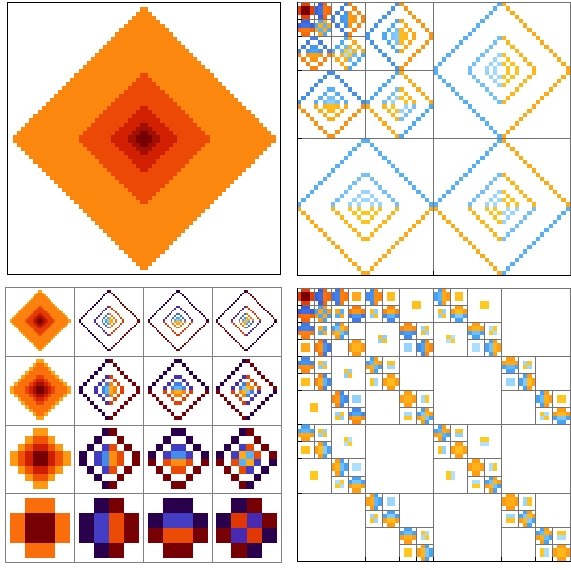
Create matrix plots of the basis tree of the wavelet coefficients for discrete wavelet transforms of a matrix using either a pyramid or grid layout.
In[1]:=
X
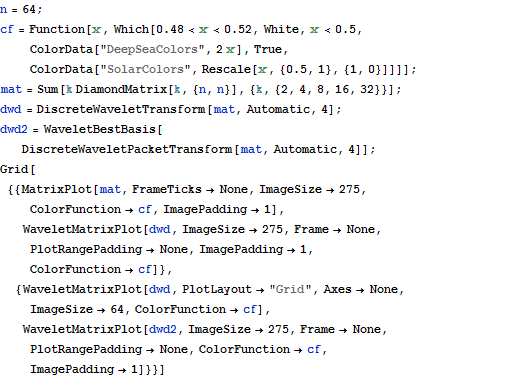
n = 64; cf = Function[x, Which[0.48 < x < 0.52, White, x < 0.5, ColorData["DeepSeaColors", 2 x], True, ColorData["SolarColors", Rescale[x, {0.5, 1}, {1, 0}]]]]; mat = Sum[k DiamondMatrix[k, {n, n}], {k, {2, 4, 8, 16, 32}}]; dwd = DiscreteWaveletTransform[mat, Automatic, 4]; dwd2 = WaveletBestBasis[ DiscreteWaveletPacketTransform[mat, Automatic, 4]]; Grid[{{MatrixPlot[mat, FrameTicks -> None, ImageSize -> 275, ColorFunction -> cf, ImagePadding -> 1], WaveletMatrixPlot[dwd, ImageSize -> 275, Frame -> None, PlotRangePadding -> None, ImagePadding -> 1, ColorFunction -> cf]}, {WaveletMatrixPlot[dwd, PlotLayout -> "Grid", Axes -> None, ImageSize -> 64, ColorFunction -> cf], WaveletMatrixPlot[dwd2, ImageSize -> 275, Frame -> None, PlotRangePadding -> None, ColorFunction -> cf, ImagePadding -> 1]}}]
Out[1]=