« View all new features in
Mathematica
9
◄
previous
|
next
►
New in
Mathematica
9
›
Random Processes
Slice Distribution for Processes
A random process
at time
is a random variable
given by its
SliceDistribution
. The slice distribution is plotted for a range of time values.
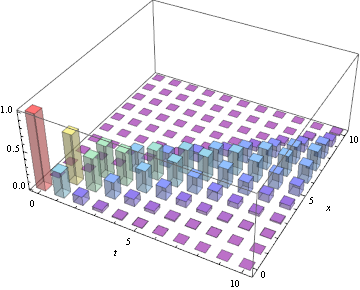
A discrete-time and discrete-state random process.
In[1]:=
X
SliceDistribution[BinomialProcess[2/3], t]
Out[1]=
In[2]:=
X
SliceDistribution[BinomialProcess[2/3], t]; DiscretePlot3D[PDF[%, x], {t, 0, 10}, {x, 0, 10}, ExtentSize -> 1/2, PlotStyle -> EdgeForm[Opacity[0.3]], FillingStyle -> Opacity[0.4], AxesLabel -> Automatic, ColorFunction -> "Rainbow", ImageSize -> Medium]
Out[2]=
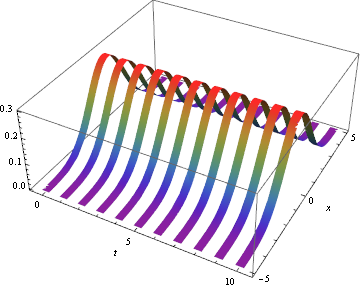
A discrete-time and continuous-state random process.
In[3]:=
X
SliceDistribution[ARProcess[{2/3}, 1], t]
Out[3]=
In[4]:=
X
SliceDistribution[ARProcess[{2/3}, 1], t]; Plot3D[Evaluate[ PDF[%, x] Sum[UnitBox[2 (t - i)], {i, 0, 10}]], {t, -0.5, 10.5}, {x, -5, 5}, MeshFunctions -> {#1 &}, Mesh -> {Sort[Join[Range[0, 10] - 0.25, Range[0, 10] + 0.25]]}, MeshShading -> {None, Automatic}, Exclusions -> {Sin[\[Pi] (t - 0.25)], Sin[\[Pi] (t + 0.25)]}, AxesLabel -> Automatic, BoundaryStyle -> None, ColorFunction -> "Rainbow", ImageSize -> Medium]
Out[4]=
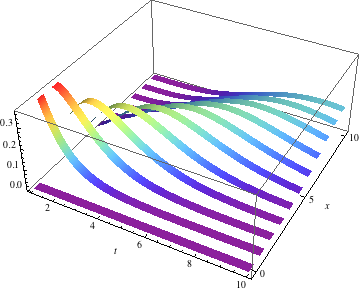
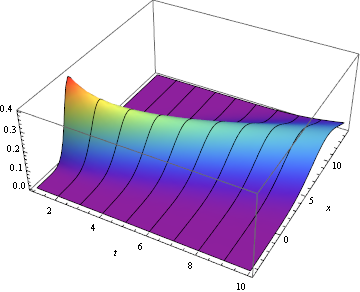
A continuous-time and discrete-state random process.
In[5]:=
X
SliceDistribution[PoissonProcess[1], t]
Out[5]=
In[6]:=
X
SliceDistribution[PoissonProcess[1], t]; Plot3D[Evaluate[ PDF[%, Floor[x - 0.25]] Sum[UnitBox[2 (x - i)], {i, 0, 10}]], {t, 1, 10}, {x, -0.5, 10.5}, MeshFunctions -> {#2 &}, Mesh -> {Sort[Join[Range[0, 10] - 0.25, Range[0, 10] + 0.25]]}, MeshShading -> {None, Automatic}, Exclusions -> {Sin[\[Pi] (x - 0.25)], Sin[\[Pi] (x + 0.25)]}, AxesLabel -> Automatic, PlotRange -> All, PlotPoints -> 75, BoundaryStyle -> None, Ticks -> {Automatic, Range[0, 10, 5], Automatic}, ColorFunction -> "Rainbow", ImageSize -> Medium]
Out[6]=
A continuous-time and continuous-state random process.
In[7]:=
X
SliceDistribution[WienerProcess[1, 1], t]
Out[7]=
In[8]:=
X
SliceDistribution[WienerProcess[1, 1], t]; Plot3D[PDF[%, x], {t, 1, 10}, {x, -3 Sqrt[10] + 5, 3 Sqrt[10] + 5}, AxesLabel -> Automatic, PlotRange -> All, MeshFunctions -> {#1 &}, Mesh -> {Range[9]}, PlotPoints -> 50, ColorFunction -> "Rainbow", ImageSize -> Medium]
Out[8]=