Slice Distributions from Data
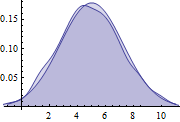
Compare the PDF from the process and simulation data at time  .
.
| In[1]:= | X |
| In[2]:= |  X |
| Out[2]= |  |
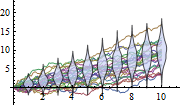
Compute several different slice distributions and overlay on simulation data.
| In[3]:= |  X |
| Out[3]= |  |
| « View all new features in Mathematica 9 | ◄ previous | next ► |
 .
. | In[1]:= | X |
| In[2]:= |  X |
| Out[2]= |  |
| In[3]:= |  X |
| Out[3]= |  |