Audio Visualization
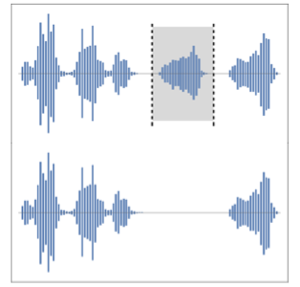
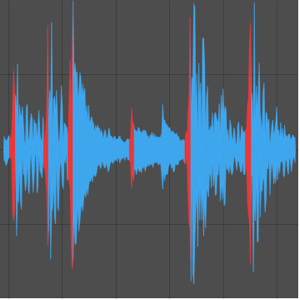
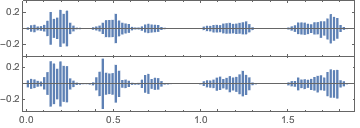
Visualize the waveform of an audio signal.
In[1]:=
a = ExampleData[{"Audio", "Bird"}, "Audio"]Out[1]=
In[2]:=
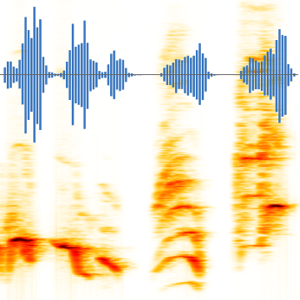
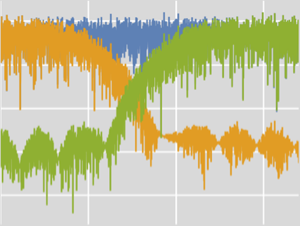
AudioPlot[a, Appearance -> "Discrete", PlotRange -> All,
 ImageSize -> Medium]
Out[2]=
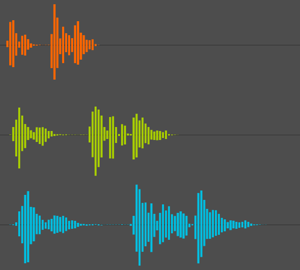
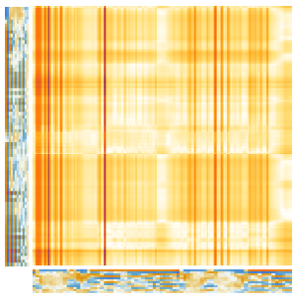
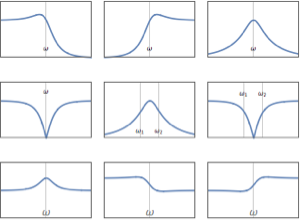
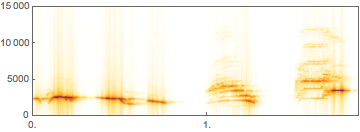
Visualize the spectrogram of the audio signal.
In[3]:=
Spectrogram[a, ImageSize -> Medium, PlotRange -> {All, {0, 15000}}]Out[3]=
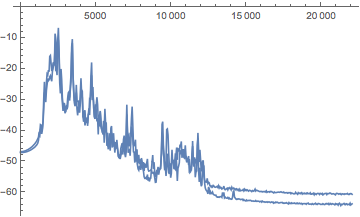
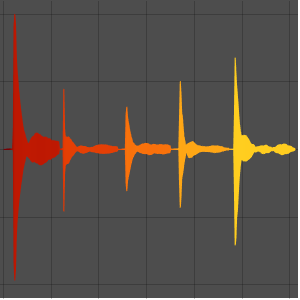
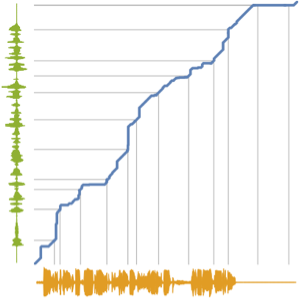
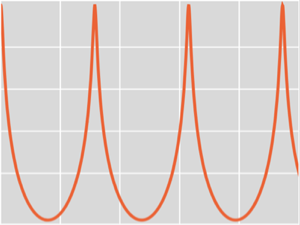
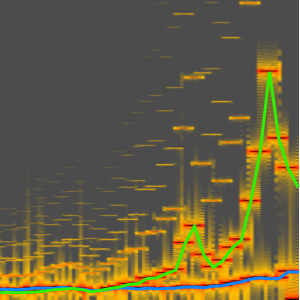
Power spectrum of the audio signal.
In[4]:=
Periodogram[a, 1000, ImageSize -> Medium]Out[4]=