수량 값의 시계열 사용
지정된 장소에서의 온도 변화를 분석합니다.
In[1]:=
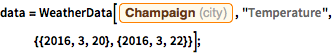
data = WeatherData[
   Entity["City", {"Champaign", "Illinois", "UnitedStates"}],
   "Temperature", {{2016, 3, 20}, {2016, 3, 22}}];
In[2]:=
temps = TimeSeries[data, MissingDataMethod -> "Interpolation"]Out[2]=
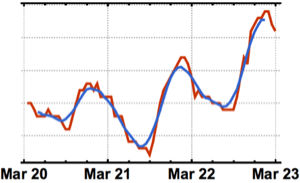
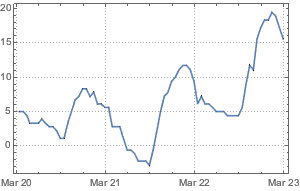
기온의 시계열을 시각화합니다.
In[3]:=
DateListPlot[temps, PlotTheme -> "Detailed"]Out[3]=
기본 특성을 살펴봅니다.
In[4]:=
stats = {Min, Max, Mean, Median, StandardDeviation};
TableForm[{Map[#[temps] &, stats]}, TableHeadings -> {None, stats}]
Out[4]//TableForm=
온도를 화씨로 변환합니다.
In[5]:=
tempsF = UnitConvert[temps, "DegreesFahrenheit"];
TableForm[{Map[#[tempsF] &, stats]}, TableHeadings -> {None, stats}]
Out[5]//TableForm=
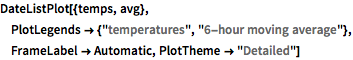
6시간의 이동 평균을 구합니다.
In[6]:=
avg = MovingMap[Mean, temps, {Quantity[6, "Hours"], Center}]Out[6]=
전체 Wolfram 언어 입력 표시하기
Out[7]=