处理值为数量的时间序列
分析给定地点的气温变化情况.
In[1]:=
data = WeatherData[
   Entity["City", {"Champaign", "Illinois", "UnitedStates"}],
   "Temperature", {{2016, 3, 20}, {2016, 3, 22}}];
In[2]:=
temps = TimeSeries[data, MissingDataMethod -> "Interpolation"]Out[2]=
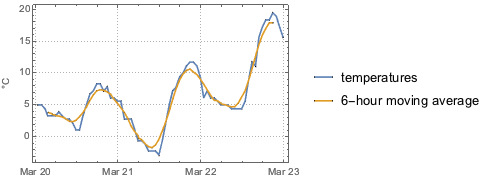
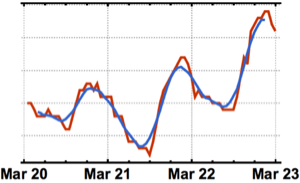
可视化温度时间序列.
In[3]:=
DateListPlot[temps, PlotTheme -> "Detailed"]Out[3]=

基本属性.
In[4]:=
stats = {Min, Max, Mean, Median, StandardDeviation};
TableForm[{Map[#[temps] &, stats]}, TableHeadings -> {None, stats}]
Out[4]//TableForm=
把温度的单位转换成华氏度.
In[5]:=
tempsF = UnitConvert[temps, "DegreesFahrenheit"];
TableForm[{Map[#[tempsF] &, stats]}, TableHeadings -> {None, stats}]
Out[5]//TableForm=
计算 6-小时的移动平均.
In[6]:=
avg = MovingMap[Mean, temps, {Quantity[6, "Hours"], Center}]Out[6]=
显示完整的 Wolfram 语言输入
Out[7]=