Parameter Estimation from Quantity Data
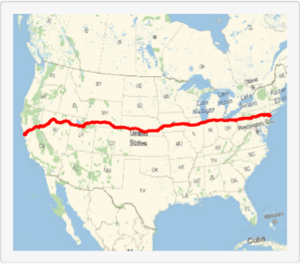
Get the lengths of major rivers in North America in miles.
In[1]:=
data = Quantity[ExampleData[{"Statistics", "RiverLengths"}], "Miles"];In[2]:=
h = Histogram[data, 30, PDF, Frame -> True, FrameLabel -> Automatic,
  PlotTheme -> "Detailed"]
Out[2]=

EstimatedDistribution accepts quantity data and returns QuantityDistribution with the units of the data.
In[3]:=
edist1 = EstimatedDistribution[data,
  InverseGammaDistribution[a, b, c, d]]
Out[3]=
Estimate model in different units.
In[4]:=
edist2 = EstimatedDistribution[data,
  QuantityDistribution[InverseGammaDistribution[a, b, c, d],
   "Kilometers"]]
Out[4]=
Convert the first model to kilometers.
In[5]:=
UnitConvert[edist1, "Kilometers"]Out[5]=
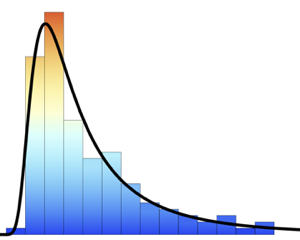
Plot the data histogram together with the fitted model PDF.
In[6]:=
Show[h, Plot[PDF[edist1, Quantity[x, "Miles"]], {x, 0, 2000}]]Out[6]=