World Nuclear Reactors
NuclearReactorData provides data on the known nuclear reactors all over the world. Some of them have already been shut down, like Chernobyl. You can select the reactors that are currently operational for the analysis of nuclear energy resources.
reactors = NuclearReactorData[];
active = Keys@
   Select[EntityValue["NuclearReactor", "Status",
     "EntityAssociation"], # === "operational" &];
Extract the annual energy production and the location country.
annualproduction =
  NuclearReactorData[active, "AnnualEnergyProduction"];
countries = Map[First, NuclearReactorData[active, "Countries"]];
Create a dataset and remove the data points that contain missing values. The number of running reactors is above 400.
data = Transpose[{active, countries, annualproduction}];
data = DeleteMissing[data, 1, 2];data // DimensionsThe number of reactors per country.
percountry = GroupBy[data, #1[[2]] &];numberpercountry = Map[Length, percountry];
BarChart[Sort[numberpercountry], ChartLabels -> Automatic,
 ChartStyle -> "DarkRainbow", BarOrigin -> Left, BarSpacing -> 1,
 LabelingFunction -> (Placed[#1, After] &), ImageSize -> Large]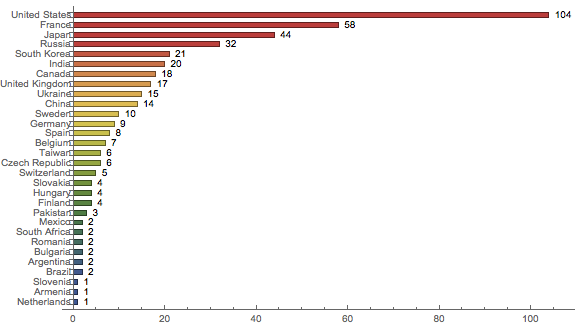
The number of reactors corresponds to the total nuclear energy produced per country.
energytotals = Map[Total[#[[All, 3]]] &, percountry];stats = {Min, Max, Mean, Median, Total};
TableForm[#[energytotals] & /@ stats, TableHeadings -> {stats}]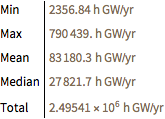
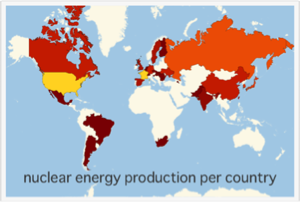
The largest producers of nuclear energy are the United States and France.
TakeLargest[energytotals, 2]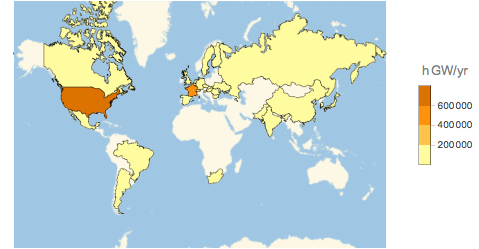
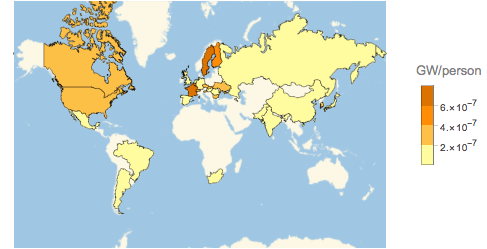
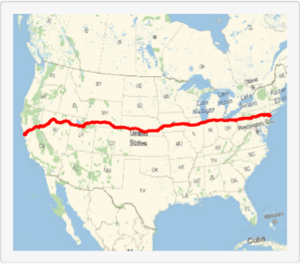
The map looks different if you consider the total energy production per capita. Use CountryData to access population totals for each country on the list.
populations =
  AssociationThread[Keys[energytotals],
   CountryData[#, "Population"] & /@ Keys[energytotals]];
Calculate nuclear energy per capita.
energypercapita = energytotals/populations;TableForm[#[energypercapita] & /@ stats, TableHeadings -> {stats}]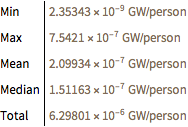
On the map, you can see that even though the USA has the largest absolute nuclear energy production, it is not the largest per person, where France and Sweden have the lead.
TakeLargest[energypercapita, 2]