Tunnels
TunnelData provides information about tunnels, such as their length and the location.
tunnels = TunnelData[];Length[tunnels]For each tunnel, find its length and location given by country or countries.
rawData = TunnelData[tunnels, {"Countries", "Length"}];Clean the data to remove missing values.
data = DeleteMissing[rawData, 1, 2];Convert the length data to miles.
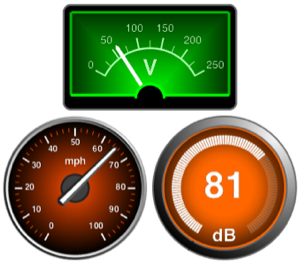
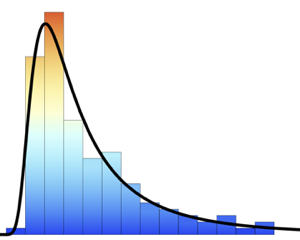
data[[All, 2]] = UnitConvert[N[data[[All, 2]]], "Miles"];lengths = data[[All, 2]];MinMax[lengths]h = Histogram[lengths, {1, 12, .5}, PDF, FrameLabel -> Automatic,
PlotTheme -> "Detailed"]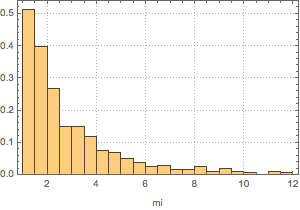
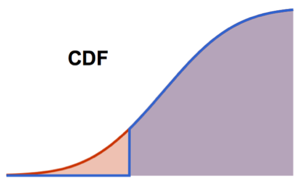
The data might be described by a mixture of long-tailed distributions.
dist = MixtureDistribution[{w1,
    w2}, {ParetoDistribution[a1, a2, a3, a4],
WeibullDistribution[b1, b2]}];edist = EstimatedDistribution[lengths, dist]Test goodness of fit against the parametric family mixture distributions.
DistributionFitTest[lengths, dist, "TestDataTable"]Plot the PDF of the fitted distribution against the histogram.
Show[h, Plot[PDF[edist, Quantity[x, "Miles"]], {x, 1, 12},
   PlotRange -> All] // Quiet]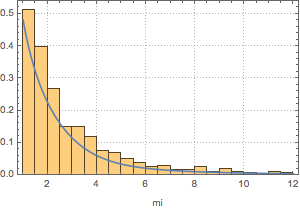
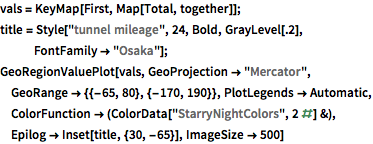
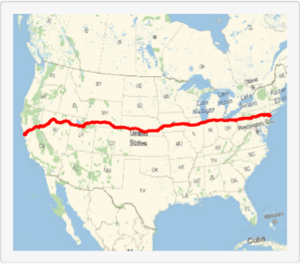
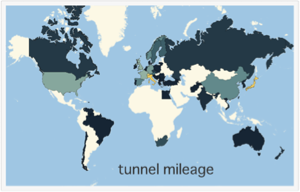
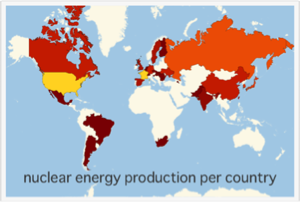
Visualize the locations of the tunnels.
Group by country.
res = GroupBy[data, First, Flatten[Take[#, All, -1]] &];Some tunnels are located in more than one country.
shared = Select[Keys[res], Length[#] > 1 &]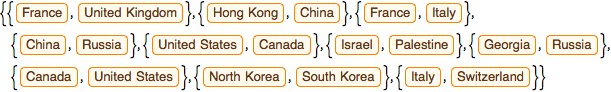
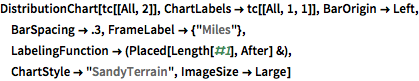
Distribute the shared tunnels and select countries that have at least 10 tunnels. Plot the length distribution chart.
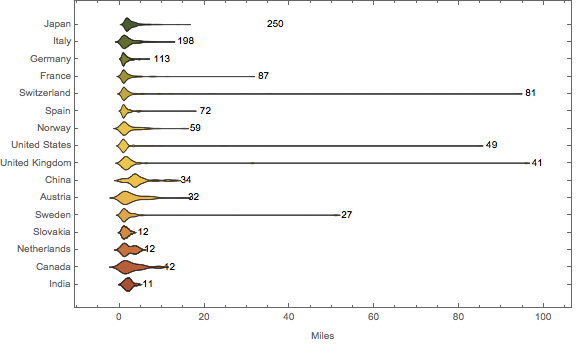
The total tunnel mileage per country with shared tunnels included in full length for each country.