Wolfram
Mathematica
8의 신기능: 통계의 시각화
◄
이전
|
다음
►
그래픽 및 시각화
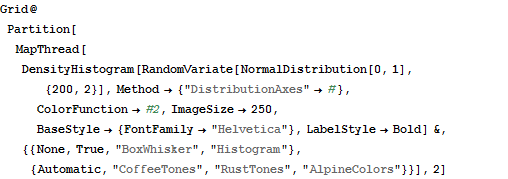
주변 분포를 가진 bin 밀도 히스토그램 표시
이변수 데이터에 대한 주변 밀도 함수를 데이터 러그, box-whisker 그리고 히스토그램으로 나타내어 봅니다.
In[1]:=
X
Grid@Partition[ MapThread[ DensityHistogram[RandomVariate[NormalDistribution[0, 1], {200, 2}], Method -> {"DistributionAxes" -> #}, ColorFunction -> #2, ImageSize -> 250, BaseStyle -> {FontFamily -> "Helvetica"}, LabelStyle -> Bold] &, {{None, True, "BoxWhisker", "Histogram"}, {Automatic, "CoffeeTones", "RustTones", "AlpineColors"}}], 2]
Out[1]=