電気工学
System Modelerを使うと,電気回路,パワーエレクトロニクス,電気機械を構築し,研究することができます.電気と機械のコンポーネントを組み合せて完全なシステムモデルを構築したり,解析タスクを実行して性能を測定したりできます.
Inverted Pendulum: Symbolic Model Linearization
Linearization makes it possible to use tools for linear systems to study nonlinear systems around an operating point. In this example, an inverted pendulum is linearized around its upright position. The goal is to analyze the behavior of the controlled inverted pendulum system for varying lengths of the pendulum.
The Model
In this example, a PID controller is used to keep the pendulum in its upright position. The pivot point of the pendulum is mounted on a cart that can move horizontally, controlled by a motor and gear arrangement.
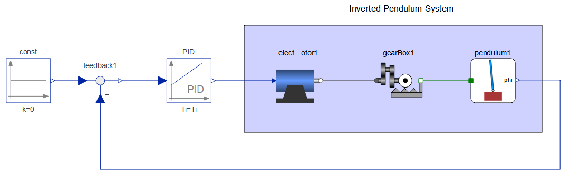
Model of the control system.
Control Design
The inverted pendulum system is linearized around its upright position. The length of the pendulum is kept in symbolic form. The control system is then designed by tuning the PID parameters for different lengths of the pendulum.
New in SystemModeler 12.0
Obtain symbolic linearization with your selected symbolic parameters.
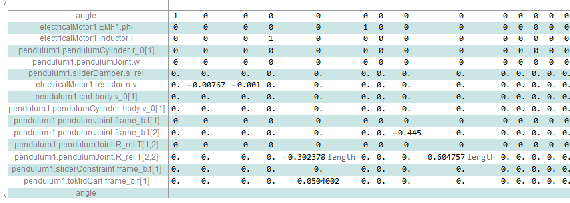
Linearized state-space representation with the length of the pendulum as the symbolic parameter.
The combined system consisting of the PID controller and the inverted pendulum is verified for stability using the Nyquist plot. The open-loop transfer function of the combined system has one unstable pole, and there is one encirclement around {-1,0} in the counterclockwise direction. As the unstable pole and encirclement cancel out, it can be inferred that the closed-loop system will have no unstable poles.
Check stability
Use Nyquist plot to check unstable poles of the closed-loop system.
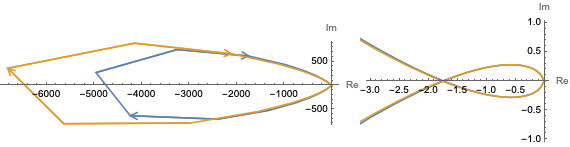
Nyquist plot for different lengths.
After verifying the stability, the model is simulated. You can now observe the raw data for the oscillations and plot the envelope of the response. You can see that with an increase in length, the time to reach steady state increases.
Deploy controller
Observe the system behavior for different lengths.
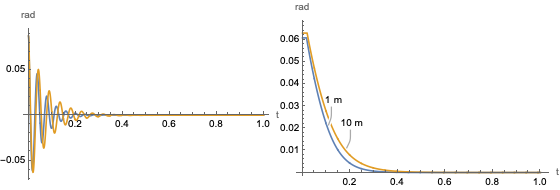
Response of the system for an initial pendulum angle of 5°.
Wolfram System Modeler
評価版
ご購入
System ModelerはWindows,macOS,
Linuxで
日本語と英語でご利用になれます »
ご質問やコメントはWolframエキスパートまでお寄せください »