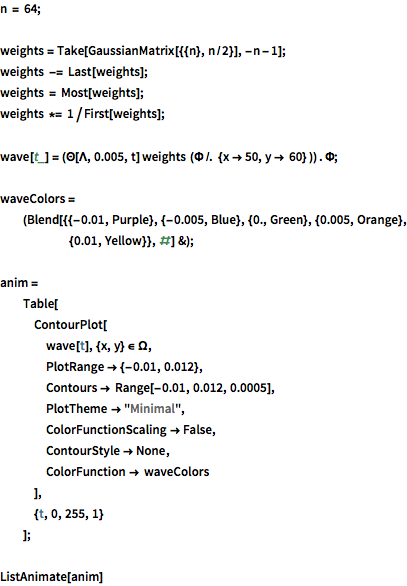
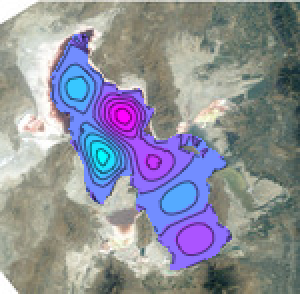
Waves in the Great Salt Lake
Using ImageMesh, you can convert image segments into BoundaryMeshRegion objects. These mesh regions allow you to utilize functions across other areas, such as finite element methods (FEM).
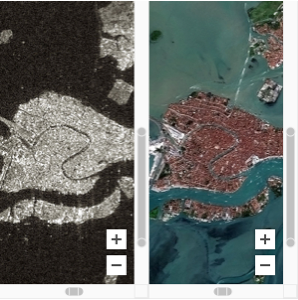
To illustrate this FEM connection, determine the major modes of surface waves on the Great Salt Lake in Utah.
img = EntityValue[Entity["Lake", "GreatSaltLake::yw8cf"], "Image"]
Regularize the image with a mean-shift filter.
img2 = MeanShiftFilter[img, 3, 0.1]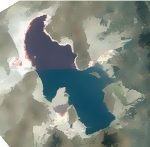
Obtain a segmentation via region growing.
mask = RegionBinarize[img2, \!\(\*
GraphicsBox[
TagBox[RasterBox[CompressedData["
1:eJzt1jEKwkAQQNFdK0uv4C1sLW0VD6AYxSZCFMRzCJ7XiF3SzFb7lf8ggUCK
D8MmM99f1sdJSuk67W/r3X3ZdbvHZtY/bNvr+dQ2h1V7a05Nt9h/Xnv21ytJ
kiRJkiRJkn5H7tVuGLMqzqo4q+KsiuNW8bKsimNWfbNwXVbF5Yzuqp0xZFUB
dBaui5kF/T5AsxJ1jNAsq0qgs3BlOSPDMrMLmvUBDcNnsbqov2x4FrWrdscA
NIu6SjCzoEOEZlGniF5Ta0eMmVXCqjjmCJlV5KzaDWNWxXGreFnMKvAIazeM
MUfIXEmtKsCs8hSWsCrOqjhmlSRJkiRJkvS/3tRrD1M=
"], {{0, 147}, {150,
       0}}, {0, 1},
ColorFunction->GrayLevel],
BoxForm`ImageTag["Bit", ColorSpace -> Automatic, Interleaving -> None],
Selectable->False],
DefaultBaseStyle->"ImageGraphics",
ImageSizeRaw->{150, 147},
PlotRange->{{0, 150}, {0, 147}}]\), 1/5]
Retrieve a BoundaryMeshRegion object of the lake surface.
\[ScriptCapitalR] = ImageMesh[mask]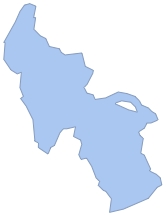
Create a mesh of the lake surface.
\[CapitalOmega] =
 TriangulateMesh[\[ScriptCapitalR], MaxCellMeasure -> 8]
Solve the wave equation of the lake surface by first determining the eigenfunctions of the Laplacian inside the lake region.
\[ScriptCapitalL] = -\!\(
\*SubsuperscriptBox[\(\[Del]\), \({x, y}\), \(2\)]\(\[CurlyPhi][x,
     y]\)\);
Using boundary condition.
\[ScriptCapitalB] = DirichletCondition[\[CurlyPhi][x, y] == 0, True];Generate an orthonormal basis of eigenfunctions Φ with eigenvalues Λ.
{\[CapitalLambda], \[CapitalPhi]} =
  NDEigensystem[{\[ScriptCapitalL], \[ScriptCapitalB]}, \[CurlyPhi][x,
     y], {x, y} \[Element] \[CapitalOmega], 64];
Display the first six oscillation modes.
GraphicsGrid[
 Partition[
  Table[ContourPlot[\[CapitalPhi][[
     k]], {x, y} \[Element] \[CapitalOmega], PlotRange -> All,
    PlotLabel -> \[CapitalLambda][[k]], PlotTheme -> "Minimal"], {k,
    6}],
  3
  ],
 ImageSize -> 512
 ]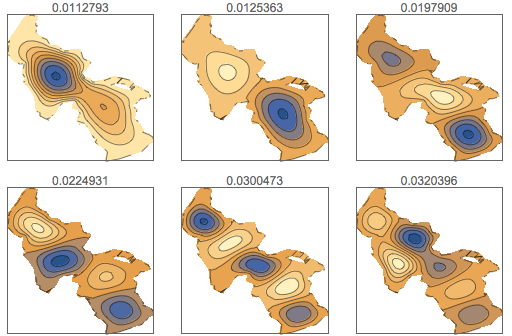
The temporal evolution of the decaying oscillation modes is given by the following.
\[CapitalTheta][\[Lambda]_, \[Xi]_, t_] = FullSimplify[
  DSolveValue[Join[{ \!\(
\*SubscriptBox[\(\[PartialD]\), \(t,
         t\)]\(\(TraditionalForm\`\[CurlyTheta]\)[
         t]\)\) + \[Xi]  \!\(
\*SubscriptBox[\(\[PartialD]\), \(t\)]\(\(TraditionalForm\`\
\[CurlyTheta]\)[
          t]\)\) == -\[Lambda] \!\(TraditionalForm\`\[CurlyTheta]\)[
        t] }, {\!\(TraditionalForm\`\[CurlyTheta]\)[0] ==
      1, \[CurlyTheta]'[0] ==
      0} ], \!\(TraditionalForm\`\[CurlyTheta]\)[t], t],
  {\[Lambda] > 0, \[Xi] > 0, \[Xi]^2 < 4 \[Lambda], t \[Element] Reals}
  ]
Expanding an initial perturbation in eigenfunctions and letting these evolve in time, a simulation of wave propagation across the lake is obtained.